

Introduction: Why “What Is Wrong With The Server?” Is The Wrong Question
The typical story: everything was fine, until it was not
From a business point of view, performance problems often appear to come out of nowhere. Yesterday your site felt fast, sales were fine, support tickets were quiet. Today you are getting complaints that the website is slow, people are abandoning baskets, and your team is asking the familiar question:
“What is wrong with the server?”
It is a natural question, especially if you pay for a particular hosting package or uptime guarantee. The logic is simple: the server is where the site lives, so the server must be the thing that has gone wrong.
In reality, performance rarely collapses because of a single broken component. It is usually the result of several small factors lining up at the same time: a bit more traffic, some heavier images, a plugin update that adds a slow database query, a backup running at the wrong time. None of these alone would bring the site to its knees, but together they push it over the edge.
Understanding that pattern is key to fixing problems safely and spending money in the right place.
Symptoms vs causes: what “slow” actually means
When people say “the server is slow”, they are usually describing symptoms, not causes. Those symptoms can be quite different:
- Pages take several seconds to start loading at all.
- Pages start loading quickly, but images and scripts take ages to finish.
- Only the checkout or login is slow, the rest of the site feels fine.
- The site is fast in the morning and painful in the afternoon.
- It is fast from one location but slow for users in another country.
Each of these points towards different parts of the system. A delayed start to page loading often hints at server or back end delays. A long “finish” time can be more about front end weight, image sizes or third party scripts. Time of day effects can indicate scheduled tasks, backups or predictable visitor peaks.
Treating “slow” as a single thing hides the detail that helps you solve the problem.
Why people want a single culprit (and why that keeps backfiring)
Most teams want a clear culprit for a simple reason: it makes decisions feel manageable. It is easier to say “the hosting is the problem” or “you have too many plugins” than to accept that several layers need attention.
There are also organisational reasons:
- Budget lines are tied to specific suppliers, so it is tempting to blame whichever supplier owns “the server”.
- Different teams own different parts of the stack. Blaming one layer can feel safer than coordinating changes across several.
- Time pressure pushes people towards quick fixes, even if they are only short term.
The risk is that you spend time and budget on the wrong thing: upgrading a server that still runs the same inefficient code, or stripping out useful functionality because “plugins are bad” when the real issue is a few specific queries.
The rest of this article is about replacing those single-villain stories with a clearer, layered picture of how performance works, and what you can practically do to improve it.
Performance Is a Chain: Many Small Links, Not One Big Lever
The request journey in plain English
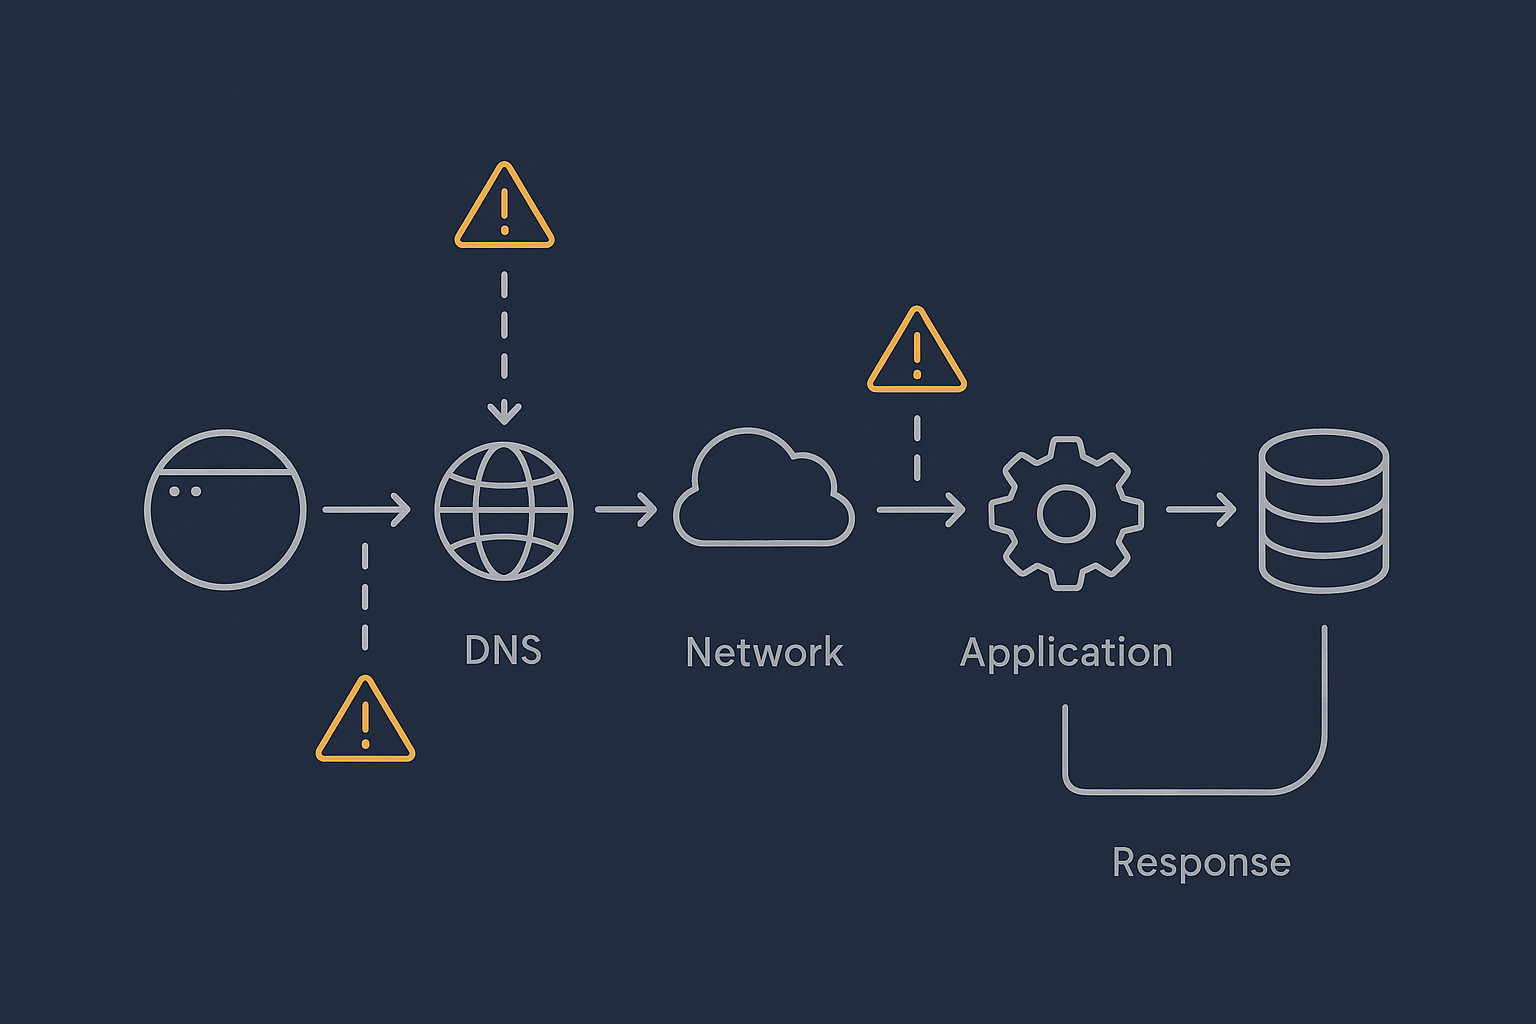
Every time someone visits your site, their request takes a journey through a chain of systems. In simplified terms:
- Their browser looks up your domain in DNS to find the server’s IP address.
- The request travels over the network to your hosting provider.
- Your web server software (for example Nginx or Apache) receives the request.
- The application layer (for example PHP and WordPress) decides what content to serve.
- The application talks to the database to fetch or update data.
- The server builds the final HTML and sends it back over the network.
- The browser downloads images, CSS, JavaScript and any third party resources.
All of this happens in fractions of a second when things are healthy. When any link in the chain slows down, the user experiences that slowdown as “the site is slow”, regardless of where the delay really lives.
Where slowness can creep in at each step
Some examples of common delays at each step:
- DNS: Long DNS TTLs are usually good, but poorly configured DNS or complex routing can add lookup time, especially for first-time visitors.
- Network: High latency for distant visitors, or congested connections between networks, can add precious milliseconds and make other delays more visible.
- Web server: Too few worker processes, misconfigured timeouts or SSL configuration can all slow the initial response.
- Application (PHP, Node, etc.): Heavy plugins, complex logic or large frameworks can use more CPU and memory per request.
- Database: Slow queries, missing indexes or table locking under write-heavy load can stall many requests at once.
- Front end: Unoptimised images, render-blocking scripts and many third party tags (analytics, chat widgets, A/B testing) can make pages feel slow even if the server responds quickly.
Notice that only some of these issues live strictly on “the server”. Many involve configuration, code, content or external services.
How minor issues combine into serious slowdowns
A helpful way to think about performance is as a series of small delays that add up. For example:
- DNS adds 80 milliseconds.
- Network adds 150 milliseconds.
- Application processing takes 400 milliseconds.
- Database adds 300 milliseconds.
- Front end assets add another 1.5 seconds.
None of these is disastrous on its own, but together your visitor waits over 2 seconds for the page to become usable, and potentially longer on mobile. If a sale or form submission also depends on several additional requests, small inefficiencies can noticeably reduce conversions.
Performance work is therefore usually about shaving off delay in many places, not flipping one big switch.
Common Oversimplifications That Waste Time and Budget
“It must be the hosting” and other one line diagnoses
Blaming the hosting provider is common, and sometimes it is correct. If the platform is consistently overloaded, suffers from frequent outages or enforces harsh resource limits, you may indeed be hitting a provider ceiling.
However, there are many times when:
- The underlying servers are healthy, but application code or database queries are inefficient.
- The site is mostly slow in one country, pointing more towards network and caching than raw server power.
- Only logged in users or certain pages are slow, which is usually an application issue.
Diagnostic data such as CPU usage, memory usage, disk I/O and response time breakdowns are more reliable guides than instinct. If you want practical commands to check these on Linux, see How to Check CPU, Memory and Disk Usage on a Linux Server.
“You have too many plugins” and blame shifting to WordPress
If you run WordPress, you may have heard “your site is slow because you have too many plugins”. It is an easy statement to make and it sounds plausible.
In practice, the problem is less about the number and more about what each plugin does. A handful of poorly written plugins that run heavy database queries on every page can hurt performance more than twenty lightweight, well coded ones.
We cover this in detail in The Truth About WordPress Plugins: How Many Is Too Many?, but the short version is:
- Audit which plugins are actually in use.
- Measure the impact of specific plugins on page generation time.
- Replace or remove the worst offenders, rather than targeting an arbitrary plugin count.
Blaming “too many plugins” without measurement often leads to removing useful features while the real bottlenecks remain.
“Just upgrade the server” and why vertical scaling eventually fails
Upgrading to a bigger plan or migrating to a larger server can provide breathing room. It is sometimes the right tactical move, for example before a known traffic spike or while you fix deeper issues.
However, vertical scaling has limits. If the core design of the application or database does not change, each upgrade simply postpones the point at which you run into the next ceiling. You can end up paying significantly more for hosting without changing the user experience much at all.
For a deeper look at this problem, see Scaling a Website Safely: When Vertical Scaling Stops Working.
Confusing bandwidth, CPU, RAM and disk speed
People often use terms like “bandwidth” or “resources” interchangeably, but they refer to different limits:
- Bandwidth is how much data you can transfer over the network per second.
- CPU is how much processing power you have for tasks like PHP execution or image resizing.
- RAM is how much working memory your processes have available.
- Disk I/O is how quickly you can read and write data on storage.
If pages are slow because PHP is maxing out CPU, doubling your bandwidth will not help. If the disk is saturated by backups or logging, adding more RAM will not solve that bottleneck.
Accurate diagnosis means knowing which resource is actually under pressure, then deciding whether code changes, configuration or additional capacity is the best fix.
The Main Categories of Server Performance Bottlenecks

Resource limits: CPU, memory and disk I/O
This is the classic “server is struggling” picture. You might see:
- High CPU usage for long periods.
- Memory usage close to 100 percent, with processes being killed.
- Disk utilisation spiking during backups or heavy database writes.
Typical causes include:
- Traffic higher than the server was sized for.
- Background jobs (such as imports, search indexing or image processing) running at peak times.
- Multiple sites or applications sharing the same small instance.
Upgrading capacity can help, but so can staggering background work, using better caching and isolating heavy tasks onto separate workers or services.
Application inefficiencies: code, plugins and queries
Even when server resource graphs look calm, poorly optimised application logic can cause slow responses. Symptoms include:
- Slow page generation time in the application, even though CPU is low.
- Particular pages or features are always slower than others.
- Each individual request is “heavy” but the site is not yet under high traffic.
Examples:
- Plugins that run complex database queries on every page.
- Features that fetch data from external APIs synchronously.
- Code that processes large datasets in memory instead of streaming or paginating.
Performance profiling tools, application logs and APM (Application Performance Monitoring) can help pinpoint which functions or queries are responsible. This kind of tuning usually sits with developers rather than the hosting provider.
Database pressure and locking
Databases often become the quiet bottleneck. Common signs:
- Queries that used to be fast now take seconds.
- Lock wait timeouts or deadlock errors in logs.
- CPU spikes on the database server even when web traffic looks moderate.
Typical patterns include:
- Large tables without suitable indexes.
- Reports or exports that scan entire tables during busy hours.
- WooCommerce orders or sessions tables growing without housekeeping.
- Frequent writes to the same rows or tables causing lock contention.
Fixes can involve query optimisation, better indexing, archiving old data, and in some cases separating read and write workloads or moving to a more robust database setup.
Network, DNS and external services
Not all delays are within your hosting environment. External factors include:
- DNS misconfigurations or slow resolvers.
- High latency for visitors far from the hosting location.
- Third party services such as payment gateways, marketing scripts or personalisation platforms.
If your checkout waits synchronously for a slow API response from a payment or shipping provider, your own server may appear to be “slow” even while it is mostly waiting for someone else.
Content delivery networks (CDNs) and edge caching can reduce the impact of distance for static assets and, in some cases, for HTML pages as well.
Security, bots and background tasks quietly eating capacity
Not all traffic is good traffic. Automated scans, bots and attempted attacks can consume a surprising amount of CPU, memory and bandwidth.
Examples:
- Bots crawling every possible URL and triggering heavy queries.
- Login attempts and brute force attacks generating high PHP load.
- Background cron jobs, backups or report generation scheduled for daytime.
Filtering abusive traffic before it reaches PHP and the database, and scheduling heavy maintenance work for quieter periods, can significantly improve stability without changing your application logic.
Why Shared Hosting, VPS and Virtual Dedicated Servers Behave Differently Under Load
Shared hosting: noisy neighbours and hard limits
On shared hosting, many customers share the same physical server. Resources such as CPU, disk and network are divided between them, and there are usually hard limits to prevent one site overwhelming the rest.
This has benefits:
- Lower cost per site.
- Less infrastructure to manage directly.
But under load you may see:
- “Noisy neighbour” effects when someone else on the server is busy.
- Throttling if your site exceeds its fair share of resources.
- Less flexibility in tuning lower level settings.
These platforms are often suitable for smaller sites, but they are not always ideal for heavier WooCommerce stores or custom applications that need consistent performance and deeper tuning.
VPS / VDS: more isolation, but more things to manage
A virtual private server (VPS) or virtual dedicated server (VDS) gives you a dedicated slice of resources on a physical host. Your performance is much less affected by neighbouring customers.
Trade offs include:
- More control over CPU, RAM and storage allocation.
- Freedom to tune web server, PHP and database configuration.
- Responsibility for security hardening, updates and monitoring, unless you choose a managed option.
Under load, a VPS or VDS will usually behave more predictably than shared hosting, but you or your provider must pay closer attention to capacity planning and maintenance.
When a managed platform hides complexity for you
Managed hosting platforms can be built on shared infrastructure or on dedicated instances, but the key difference is who handles operational detail.
A managed platform might:
- Monitor resource usage and tune services proactively.
- Apply security patches and handle backup schedules.
- Provide web hosting performance features such as caching and smart PHP worker configuration.
This does not remove the need to write efficient code or choose plugins carefully, but it does reduce the risk that simple configuration issues or missed updates turn into performance problems.
A Practical, Layered Approach To Diagnosing Slow Servers
Step 1: Confirm the symptoms and scope
Start by clarifying what users are actually experiencing:
- Which pages or actions are slow?
- Is the slowness constant, or does it vary by time of day?
- Is it worse for logged in users, admins, or specific roles?
- Do the issues affect all regions or just some?
Front end tools such as browser developer tools can show whether delays are mostly in the “waiting for server” stage or in downloading assets.
Step 2: Check basic server health (CPU, RAM, disk and processes)
Next, look at system metrics during or close to the slow periods:
- CPU usage patterns over time.
- Memory utilisation and swap usage.
- Disk I/O and storage capacity.
- Which processes are using the most resources.
If you do not already have a monitoring stack, even basic command line checks and your hosting control panel graphs can reveal whether the server is under obvious strain.
Step 3: Separate front end issues from back end load
It is important to distinguish between:
- The time the server takes to generate and send the initial HTML response.
- The time the browser takes to download and render everything.
If the back end is fast but the page still feels slow, focus on:
- Image optimisation and formats.
- Reducing unnecessary scripts and third party tags.
- Leveraging caching and compression for static assets.
If the initial response is slow, that points more towards application logic, database queries or resource contention.
Step 4: Look for patterns in traffic, spikes and specific actions
Overlay traffic data and server metrics:
- Do slow periods line up with busy visitor peaks, marketing campaigns or newsletter sends?
- Do they match backup windows or large imports?
- Is there a repeating pattern on specific days of the week or times?
On transactional sites, pay attention to specific actions like search, add to basket, login or checkout. These often trigger heavier queries and business logic.
Step 5: Identify the mix of causes, not a single villain
With the above context, you can identify combinations like:
- Heavy homepage queries + peak advertising traffic + shared hosting CPU limits.
- Uncached WooCommerce cart fragments + third party scripts + mobile visitors on slower networks.
- Bot traffic crawling every URL + daytime backups + under-sized database volume.
Addressing each contributing factor may be less dramatic than changing provider overnight, but it is far more likely to give you stable, predictable performance.
For WordPress-specific tools and metrics, you might find How to Diagnose Slow WordPress Performance Using Real Tools and Metrics a useful follow up.
Real World Examples: How Multiple Small Issues Add Up
Example 1: WooCommerce store that only breaks on peak days
Imagine a WooCommerce shop that feels fine most of the time, but every Black Friday or pay day the checkout slows to a crawl. The instinct might be “our hosting cannot handle the load”.
In practice, we often see a combination such as:
- Product and order tables that have grown large without indexing or archiving.
- Cart and stock-check queries that are not cached for logged in users.
- Shared hosting limits reached when marketing campaigns spike traffic.
- Payment and shipping API latency that only becomes visible under high concurrency.
A more robust architecture for this scenario might involve moving to a WooCommerce hosting setup sized for peak load, improving database design and using appropriate caching, rather than only buying a bigger server for a few days a year.
Example 2: Business site that feels slow despite low CPU usage
A company site with mainly informational pages reports slowness, but server graphs show low CPU and memory usage. The temptation is to dismiss it as “fine”.
Looking closer reveals:
- Huge uncompressed images on the homepage.
- Several marketing scripts loading synchronously from third party domains.
- No caching or content delivery network, so every asset comes directly from the origin server.
Here, the issue is mostly front end weight and network latency, not back end resources. Optimising images, trimming scripts and introducing edge caching can transform the perceived speed without changing the server specification.
Example 3: Site under bot and attack noise that looks like “normal traffic”
Another frequent scenario is a site that appears to have “grown” in traffic, but closer inspection shows a large proportion of automated requests:
- Bots hitting search and archive URLs repeatedly.
- Login and XML-RPC attacks on WordPress sites.
- Scrapers requesting every possible parameter combination.
Server-side logs show high PHP and database usage, yet human users are not much higher than before. Implementing better bot filtering and rate limiting, ideally before requests reach PHP, can reclaim capacity for real visitors without needing a large scale infrastructure change.
Designing Hosting So Performance Problems Are Easier To Manage
Caching properly at multiple layers

Caching is one of the most effective tools for improving performance and resilience. It can live at several levels:
- Browser caching for static assets such as images and CSS.
- Edge or CDN caching for pages and assets close to the visitor.
- Application-level caching for query results and expensive calculations.
A well designed stack means that most requests are served from cache, with only a smaller proportion needing full PHP and database work. This not only speeds up responses but also gives you more headroom during traffic spikes.
Features such as the G7 Acceleration Network can help by caching content at the edge, optimising images to formats like AVIF and WebP on the fly and often cutting image transfer size by more than 60 percent. This reduces both bandwidth use and time-to-first-paint, especially on mobile connections.
Keeping bad bots and abusive traffic away from PHP and the database
Filtering and shaping traffic before it reaches the application layer protects both performance and security. Practical steps include:
- Rate limiting for expensive endpoints like search or login.
- Blocking known bad user agents and behaviour patterns.
- Using a web application firewall or edge layer to drop abusive requests early.
From a business perspective, this is about reserving capacity for real users. It is often cheaper to do this at the edge or load balancer layer than to size your application servers to absorb all traffic, good and bad.
Right sizing: when to move from shared to VDS or enterprise setups
At some point, higher stakes and higher loads justify moving beyond basic shared hosting:
- If downtime or slowdowns materially hurt revenue or reputation.
- If you need predictable performance during marketing campaigns or peak seasons.
- If compliance or data handling requirements are stricter.
Moving to virtual dedicated servers or more bespoke enterprise setups gives you more consistent resources and deeper tuning options. The trade off is extra operational responsibility unless that layer is managed for you.
Monitoring and alerting that focus on bottlenecks, not vanity metrics
Meaningful monitoring helps you spot and address issues before they become customer facing. Useful signals include:
- 95th percentile response times, not just averages.
- Error rates and timeouts, especially in the application and database.
- Resource utilisation over time and during campaigns.
- Cache hit ratios and origin load.
Metrics like “total page views” or “uptime percentage” are helpful for reporting but do not tell you where your next performance bottleneck lies.
How Managed Hosting and Managed VDS Can Reduce Performance Risk
What you should reasonably expect your provider to handle
A good hosting provider can and should take responsibility for:
- Stable, well monitored infrastructure.
- Timely security updates at the operating system and core service level.
- Backups and tested restore processes.
- Sensible defaults for web server, PHP and database configuration.
- Access to performance features such as caching and edge acceleration.
In a managed context, the provider also helps interpret metrics, plan capacity and apply configuration changes that support performance.
What still sits with your team: code, content and change control
Even with a fully managed platform, some responsibilities stay with your organisation:
- Writing or commissioning efficient application code.
- Choosing and maintaining plugins or extensions responsibly.
- Managing content weight, including image sizes and third party scripts.
- Planning and testing changes before deploying them to production.
Performance is shared work: the host provides a solid, tuned foundation, while your team controls what runs on top of it.
When specialised WordPress or WooCommerce hosting makes sense
If your business depends heavily on WordPress or WooCommerce, specialised platforms can be worthwhile. For example, managed WordPress hosting designed for these applications may include:
- Stacks tuned for PHP and database workloads typical of WordPress.
- Platform-level caching and update management.
- Tools for safe staging, cloning and rollback.
For higher volume stores, dedicated WooCommerce hosting can add further tuning around cart, checkout and order handling, where performance issues are most visible to customers.
The aim is not to make hosting a magic solution, but to reduce the operational burden so your team can focus on product and content rather than day-to-day infrastructure tuning.
Key Takeaways: Performance Is a System, Not a Switch
Questions to ask before you blame the server
When you next hear “the server is slow”, it can help to pause and ask:
- Which specific pages or actions are slow, and for whom?
- Do metrics show CPU, RAM, disk or database pressure at those times?
- Has anything changed recently in code, plugins, content or traffic patterns?
- Is there evidence of bot traffic or external services running slowly?
- What part of the page load is slow: initial response, or assets and scripts?
These questions move the conversation from blame to diagnosis.
How to plan your next hosting move with performance in mind
When planning your next step, whether that is a minor upgrade or a full redesign, consider:
- Your peak, not average, load and how often you reach it.
- Where your visitors are located and whether you need edge caching or acceleration.
- How much operational work your team can realistically take on.
- Which parts of the stack have been bottlenecks in the past.
If you would like a second pair of eyes on your current setup, or you are weighing up shared hosting, virtual dedicated servers and managed options, you are welcome to talk to G7Cloud about which hosting architecture fits your performance and risk profile.
Performance problems are rarely caused by one thing going wrong with “the server”. They are almost always the result of several small links in the chain pulling in the wrong direction at the same time. The more clearly you can see those links, the easier it becomes to design hosting, applications and processes that stay fast when it matters most.