

Who This Guide Is For (And What You Will Be Able To Read Confidently)
This guide is for VPS owners and site operators who have just discovered that “load average” and the top command matter, usually because something has gone slow at the wrong moment.
It assumes you are comfortable using SSH, but you do not need deep Linux knowledge. The aim is to make the numbers you see on a busy server understandable and less intimidating, so you can respond calmly instead of guessing.
Typical situations where load average suddenly matters
You will typically come to this topic in situations like:
- Your WordPress or WooCommerce site feels slow during busy periods.
- Your VPS provider sends an alert about “high load” or “high CPU”.
- You log in and run
topand see big load average numbers but are not sure what they really mean. - You are deciding whether to tune your site or upgrade CPU/RAM on your VPS.
In all of these cases, understanding processes, load average and top is the first step to making a sensible decision about what to do next.
What you will be able to do after reading
By the end of this guide you should be able to:
- Explain in plain language what a Linux process is.
- Read the load average and relate it to your number of CPU cores.
- Walk through the
topoutput and know what the key lines mean. - Spot the difference between CPU, RAM and I/O bottlenecks.
- Relate high load to real visitors and WordPress behaviour.
- Decide whether to optimise, scale up your VPS, or consider a managed service.
If you want to go deeper after this article, our guide on monitoring a Linux web server with built‑in tools expands on many of the ideas you will see here.
Key Concepts: Processes, CPU, RAM and I/O in Plain English
What a Linux process actually is
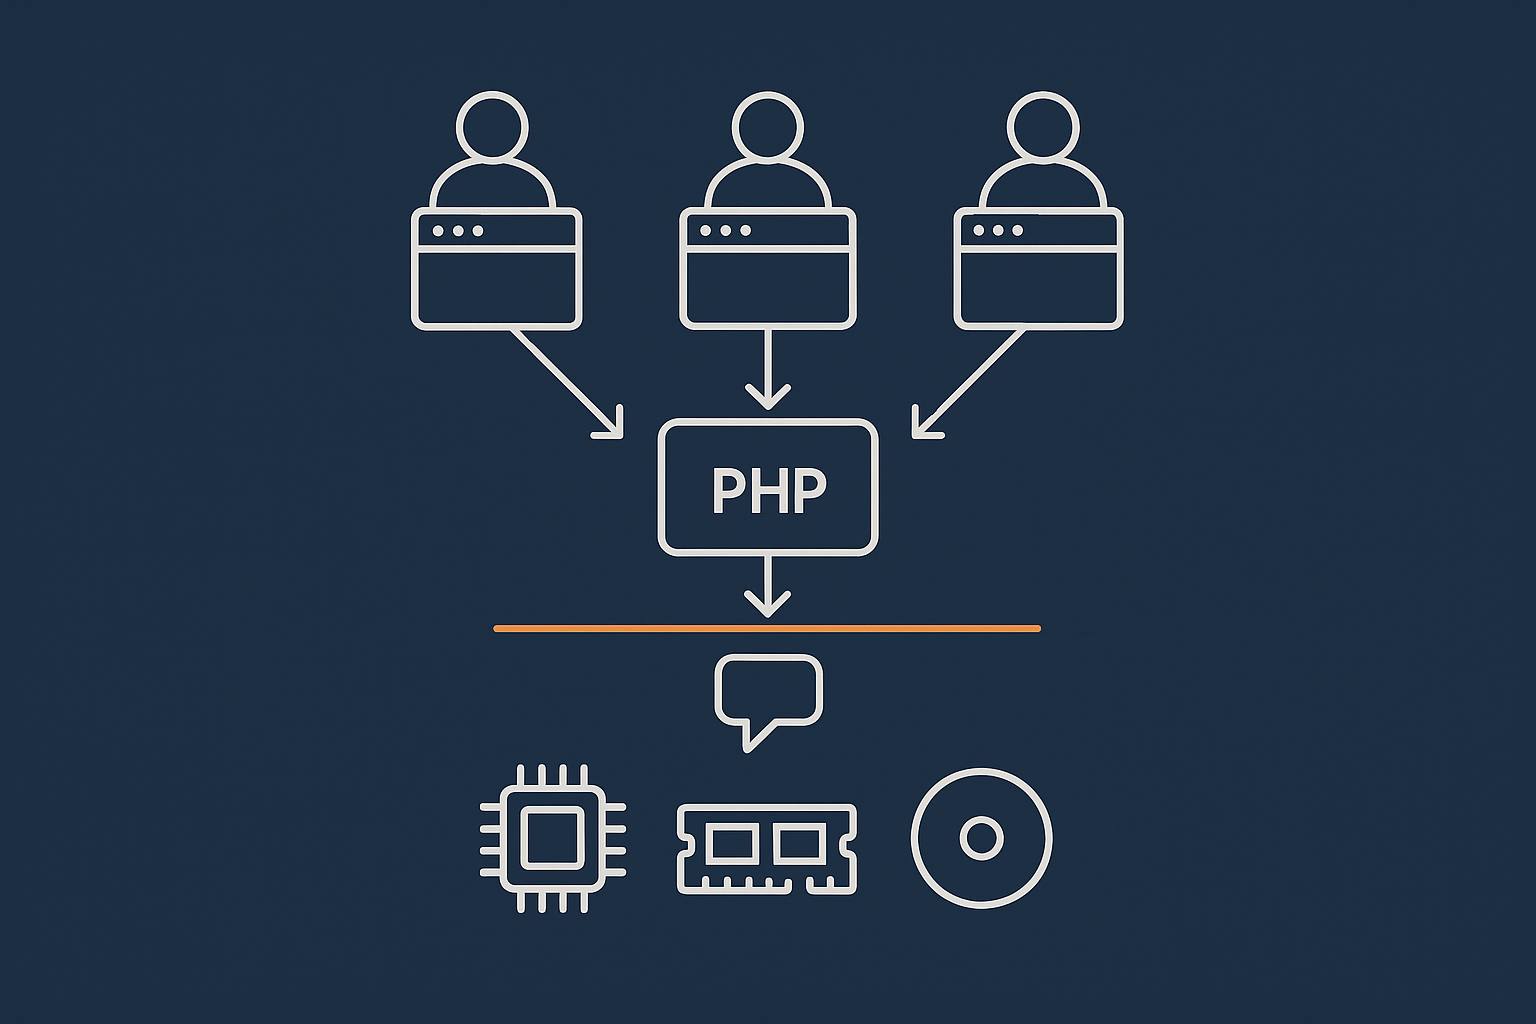
A process is simply a running program. Each PHP request, each MySQL query handler, your web server, your SSH session and your control panel all run as processes.
You can think of a process as a “task” that the operating system schedules on the CPU. Processes can:
- Use CPU time to perform calculations.
- Use RAM to keep data handy.
- Perform I/O, which means reading and writing to disk or network.
On a web server this might look like:
nginxorhttpd(Apache) processes handling incoming HTTP requests.php-fpmorphp-cgiprocesses running your WordPress code.mysqldormariadbdprocesses serving database queries.
When the server is “busy”, what is really happening is that many processes want CPU, RAM or I/O at the same time.
CPU, RAM and I/O: the main resources your VPS can run out of
Your VPS has three core resources that can become bottlenecks:
- CPU: The “brains” that execute instructions. A 2 vCPU VPS can run roughly two full CPU‑hungry processes at once.
- RAM: Short‑term memory for running processes and cached data. If you run out, the system will use swap, which is much slower.
- I/O: Input/output to disk and network. Slow storage or heavy disk access can delay processes, even when CPU use looks low.
Load average and top help you see which of these resources is under the most pressure at any given time.
How WordPress, PHP and MySQL show up as processes
On a typical LAMP or LEMP WordPress stack you will see:
- Web server processes:
apache2,httpdornginx. - PHP handler processes:
php-fpm,php-fpm7.4,php-fpm8.1and similar. - Database processes:
mysqldormariadbd.
When traffic increases, more PHP processes may spin up (depending on configuration), and MySQL will handle more queries. In top these will often be the processes consuming the most CPU or RAM on a busy WordPress or WooCommerce site.
Our article on troubleshooting high CPU and memory usage on WordPress goes further into how specific plugins and themes translate into resource usage.
First Checks on a Busy VPS: Load Average and top at a Glance
Logging in safely and running top
When a server feels slow, your first step is simply to look. The safest basic tool is top, which shows a live view of resource usage.
What you are solving: You want to see whether the problem is real (and on the server) and, if so, whether it is CPU, RAM or something else.
Log in with SSH from your terminal or client, then run:
top
What this does: top opens a full‑screen view that updates every few seconds. It does not change anything on the system by default. To exit, press q.
What to expect:
- A header with uptime, users and load average.
- CPU usage breakdown (user, system, idle, etc.).
- Memory and swap usage lines.
- A list of processes sorted by CPU usage.
If top feels cramped, you can safely resize your terminal window; it will adapt. You can also just close the SSH session to exit.
Where load average appears and why it is often misread
At the top of top you will see a line similar to:
top - 14:22:10 up 10 days, 3:01, 1 user, load average: 0.95, 1.23, 1.05
The three numbers after “load average” are averages over:
- 1 minute
- 5 minutes
- 15 minutes
Many people assume these are percentages or that anything above 1 is “bad”. That is not correct. They represent how many processes were waiting to run, relative to the number of CPU cores you have. You will see how to interpret them properly in the next section.
A safe, quick triage routine when the server feels slow
Once you are in top, you can follow this quick checklist:
- Look at the 1, 5 and 15 minute load averages and write them down.
- Check CPU usage: is “id” (idle) close to 0%, or is there plenty of idle CPU?
- Check memory: is swap being used heavily and increasing?
- Look at the top 3 to 5 processes by
%CPUand%MEM.
This gives you a snapshot. It is good practice to keep a simple log of what you saw (for example in a shared document) so you can compare with future incidents.
Understanding Linux Load Average Properly

What load average measures (and what it does not)
Load average measures the average number of processes that are:
- Running on a CPU core, or
- Waiting in the run queue for CPU time, or
- Sometimes, blocked on I/O (depending on kernel and state).
It does not directly measure:
- Network traffic volume.
- Number of site visitors.
- Disk usage space.
A quick way to think of it:
- Load of 1.0 on a 1‑core VPS: one process on average needs the CPU. That is fully busy but not necessarily overloaded.
- Load of 2.0 on a 1‑core VPS: on average one process is running and one is waiting. This means contention.
- Load of 2.0 on a 2‑core VPS: similar to 1.0 on a 1‑core VPS, often fine.
This is why you must always think of load average relative to the number of vCPUs in your plan.
Interpreting load on 1‑core, 2‑core and 4‑core VPS plans
As a rule of thumb:
- 1 vCPU VPS:
- Load 0.5 to 1.0: light to moderate usage.
- Load 1.0 to 2.0: busy, some queuing.
- Load above 2.0 for long periods: likely overloaded.
- 2 vCPU VPS:
- Load 1.0 to 2.0: normal under load.
- Load 2.0 to 4.0: busy, but may still be acceptable if performance is fine.
- Load above 4.0 sustained: signs of strain.
- 4 vCPU VPS:
- Load 2.0 to 4.0: typical moderate workload.
- Load 4.0 to 8.0: heavy but not always a problem.
- Load consistently above 8.0: investigate further.
Short spikes can be harmless, especially during backups or deployments. Long‑running high load is what usually affects users.
When a high load average is normal and when it is a problem
High load is normal when:
- You are running a backup that stresses disk or CPU for a few minutes.
- You are compressing logs or rebuilding caches.
- You are performing a software build or similar batch job.
High load is a problem when:
- It persists for tens of minutes or hours.
- At the same time, users report slow page loads or timeouts.
- CPU is near 100% for long periods, or swap usage is climbing.
Always relate the numbers back to user experience: are pages slow or failing, or is everything working fine?
Common myths about load average that confuse WordPress users
Some frequent misconceptions:
- “Load above 1 means the server is overloaded”
This is only true for a 1 vCPU server and even then not always. A multi‑core VPS can comfortably run load numbers higher than 1. - “Load average tells me how many visitors I have”
It does not. Load shows process pressure, not user count. A single badly behaved plugin can increase load even with few visitors. - “I must reboot when load is high”
A reboot often only hides the underlying issue for a short time. It is better to identify the specific process or configuration that is causing the load.
Reading top Output Line by Line

The header lines: uptime, users, load, tasks and CPU breakdown
When you run top, the first few lines look like this (simplified):
top - 14:22:10 up 10 days,  3:01,  1 user,  load average: 0.95, 1.23, 1.05
Tasks: 103 total,   1 running, 102 sleeping,   0 stopped,   0 zombie
%Cpu(s):  5.0 us,  2.0 sy,  0.0 ni, 90.0 id,  3.0 wa,  0.0 hi,  0.0 si,  0.0 st
Here is what the important parts mean:
- Uptime: How long the server has been running since the last reboot.
- Users: Number of logged‑in users (usually SSH sessions).
- Load average: 1, 5 and 15 minute averages, as discussed earlier.
- Tasks:
running: actively using CPU.sleeping: waiting for work or I/O.zombie: finished but not fully cleaned up.
- %Cpu(s):
us: user space (applications such as PHP, MySQL).sy: system (kernel work, I/O handling).id: idle (unused CPU capacity).wa: waiting on I/O (disk or sometimes network).st: stolen time on virtualised environments.
On a CPU‑bound system you will see high us and low id. On an I/O‑bound system you might see moderate us but elevated wa.
Memory and swap: spotting real RAM pressure
The next lines show memory:
MiB Mem :   3949.5 total,    210.0 free,   2850.3 used,    889.2 buff/cache
MiB Swap:   2048.0 total,   1024.0 free,   1024.0 used.   120.0 avail Mem
Key points:
- Mem total: how much RAM you have.
- used: what is currently in use by processes and cache.
- buff/cache: Linux uses spare RAM to cache disk data. This is normal and helpful; cached memory can be reclaimed if needed.
- Swap used: how much data has been moved from RAM to disk.
Real concern starts when:
- Swap usage is high and steadily increasing, and
- At the same time, the server feels slow and CPU is not maxed out.
That pattern often indicates your VPS does not have enough RAM for its workload. Our guide to practical capacity planning can help you decide when it is time to scale resources.
The process list: what %CPU, %MEM and STAT actually mean
The bottom half of top is a table of processes. The key columns are:
- PID: Process ID. Useful for tracing or stopping a specific process.
- USER: Account the process runs under (for example
www-data,mysql). - %CPU: Percentage of one CPU core the process is using. On a 4‑core server a single process can show up to roughly 400% depending on
topconfiguration. - %MEM: Percentage of total RAM used by the process.
- STAT: Process state. Common letters:
R: running.S: sleeping (waiting for input).D: uninterruptible sleep (often I/O wait).Z: zombie.
- COMMAND: Program name, often with arguments.
On a busy WordPress site you might see several php-fpm processes near the top, sometimes a heavy mysqld, and perhaps backup or cron jobs like tar or rsync.
Sorting and filtering in top without breaking anything
top allows you to change sort order and filter processes without any risk to the system. A few safe keys:
- Press
Pto sort by%CPU(default on many systems). - Press
Mto sort by%MEM. - Press
1(on many distributions) to show per‑CPU usage lines. - Press
hto see the help screen and available keys.
All of these affect only your view. They do not change system behaviour. To leave top, press q.
Typical Bottlenecks You Can Spot With top
CPU‑bound: one or more processes pegging the cores
A CPU‑bound server will usually show:
- High overall
%Cpu(s)usage with lowid(idle) percentage. - One or more processes at high
%CPUnear the top of the list. - Load average roughly at or above the number of CPU cores.
Common causes include:
- CPU‑heavy PHP or MySQL queries (complex WooCommerce reports, exports).
- Backup or compression tasks running during peak hours.
- Resource‑intensive scripts or cron jobs.
In the short term you can:
- Note which commands are responsible.
- If appropriate, temporarily pause or reschedule batch tasks to quieter times.
Be careful about killing processes you do not recognise. A safer next step is often to examine logs and configuration rather than forcefully stopping services.
RAM‑bound: swapping and slow but not maxed‑out CPU
A RAM‑bound system often looks like:
- Moderate CPU usage with some idle capacity.
- High or growing swap usage in the memory lines.
- Higher load average than you would expect from CPU figures alone.
- Processes with large
%MEM, for examplemysqldor manyphp-fpmworkers.
Symptoms can include slow page loads, especially for uncached pages and admin actions.
Potential actions:
- Reduce memory‑heavy features or plugins.
- Review database and PHP settings that control cache and buffer sizes.
- Increase RAM in your VPS plan if the workload is legitimate and stable.
I/O‑bound: high load average but low %CPU
An I/O‑bound system is usually characterised by:
- High load average numbers.
- Relatively low
usandsyCPU usage. - Significant
wa(I/O wait) percentage. - Many processes in
Dstate in the STAT column.
This can be caused by:
- Heavy disk activity from backups, imports or big data exports.
- Slow storage or underlying host contention.
- Very chatty applications constantly reading/writing small files.
Tools like iotop (discussed in more detail in our monitoring article) can help pinpoint which processes are causing heavy disk I/O.
Burst traffic vs constant overload on WordPress and WooCommerce
Not all high load is equal. On WordPress and WooCommerce you might see:
- Burst traffic:
- Short spikes in load average.
- CPU jumps briefly but returns to normal.
- Often caused by a marketing campaign or email blast.
- Constant overload:
- Load average high for hours or days.
- Users consistently see slow responses.
- Often caused by inefficient plugins, uncached dynamic pages or inadequate resources.
Bursts can often be handled with better caching and edge optimisation. Persistent overload may point to the need for code optimisation or increased resources.
From top to Next Steps: Drilling Down Safely
Linking process names back to services and applications
Once you know which process is heavy, you need to understand which service or application it belongs to. Common mappings:
php-fpmorphp*: PHP handling web requests, usually your WordPress code.mysqld/mariadbd: the MySQL or MariaDB database used by WordPress.nginx/apache2/httpd: the web server responding to HTTP requests.cron,wp-cron.php: scheduled jobs, potentially plugin tasks.
With the PID from top, you can inspect details with:
ps -p <PID> -o pid,user,pcpu,pmem,command
Replace <PID> with the process ID you saw in top. For example:
ps -p 12345 -o pid,user,pcpu,pmem,command
What this does: Shows a one‑line summary of that process including the full command. It does not modify anything. You can run it repeatedly and safely.
Using ps, htop and simple logs alongside top
top is ideal for a quick live overview. To dig further you can use:
htop: a more visual, interactive version oftop(if installed).ps: for simple process lists or scripting.- Logs: for example:
- Web server logs in
/var/log/nginx/or/var/log/apache2/. - PHP error logs, often in
/var/log/php*. - MySQL logs in
/var/log/mysql/or similar.
- Web server logs in
Our guide on practical Linux log file basics explains how to find and read the most important logs so you can relate heavy processes in top to specific errors or patterns.
When to restart a service and when to leave it alone
Restarting a service such as PHP‑FPM or MySQL can sometimes clear stuck processes or memory leaks, but it is a blunt tool.
Before restarting, consider:
- Can you safely restart without disrupting active users or orders?
- Have you identified the likely cause (for example a particular plugin or script)?
- Can the problem be reproduced on a staging or test environment?
Restarting web‑facing services will briefly interrupt connections, so:
- On production WooCommerce stores, plan restarts for quieter times where possible.
- Make a quick note of the time and what you restarted to aid future analysis.
If you are unsure, it is often better to gather data first and ask for assistance rather than restarting services repeatedly.
When a managed VDS is the safer way to handle busy periods
On an unmanaged VPS you are responsible for:
- Regular OS and package updates.
- Security hardening and monitoring alerts.
- Performance tuning of web server, PHP and database.
- Capacity planning as your traffic grows.
When traffic and complexity increase, these tasks become both more important and more time‑consuming. A managed virtual dedicated server can be a safer choice if:
- You need consistent performance under load but do not want to be a full‑time server administrator.
- Your site is business‑critical and you want expert help interpreting metrics and planning upgrades.
Managed does not mean you cannot learn or use top. It simply means you have a team to turn observations into safe configuration changes and tuning.
Relating Server Load to WordPress, WooCommerce and Real Users
How PHP workers and slow plugins show up in process lists
Each uncached WordPress page view typically corresponds to at least one PHP process and several database queries. Heavy plugins and themes can:
- Increase the CPU time per request.
- Increase RAM usage per process.
- Cause more complex or frequent database queries.
In top this appears as:
- Many
php-fpmprocesses with non‑trivial%CPUand%MEM. mysqldrising to the top of the CPU or memory list during peaks.
Our article on PHP workers, concurrency and WooCommerce explains how the number of PHP workers you have configured sets an upper bound on concurrent uncached requests your server can handle comfortably.
Why caching and the G7 Acceleration Network reduce backend load
Good caching reduces how often PHP and MySQL need to be involved in serving a page. Instead of executing WordPress code, your server can return a pre‑generated HTML page.
Edge optimisation goes a step further by reducing unnecessary work before it even reaches your VPS. The G7 Acceleration Network can help in several ways:
- Automatically converting images to AVIF and WebP on the fly, often reducing image file sizes by more than 60 percent without changing your WordPress plugins.
- Filtering abusive or non‑human traffic before it hits PHP or your database, which reduces wasted CPU cycles and helps keep performance stable under traffic spikes.
The result is fewer PHP processes running at once and less database load for the same number of real visitors.
Deciding between optimisation and upgrading your VPS resources
When you understand top output, the upgrade decision becomes clearer. Consider:
- Optimisation first if:
- Load is high only during specific plugins or admin actions.
- You have little or no caching configured.
- A few processes are clearly misbehaving.
- Resource upgrade if:
- Load is consistently high even after reasonable optimisation.
- CPU and RAM usage scale predictably with legitimate traffic.
- You are frequently close to max CPU and RAM during normal operations.
It is perfectly reasonable to combine both: modest optimisation plus a carefully sized increase in CPU or RAM usually gives the best stability.
For smaller sites where all of this feels like too much, Managed WordPress hosting can be a practical alternative. It shifts most tuning and scaling work to the hosting team while you focus on content and business tasks.
Common Mistakes and Safety Notes for Beginners
Killing the wrong process: what to avoid
This is one area where commands can break things if misused. The kill command terminates processes. If you stop the wrong one you may interrupt your database, web server or other critical services.
If you truly need to stop a runaway process and have identified it clearly, the gentlest approach is:
kill <PID>
This asks the process to terminate cleanly. Only if it ignores this should you consider:
kill -9 <PID>
Warning: kill -9 forces an immediate stop, which can interrupt disk writes or leave temporary files. Avoid using it on database processes like mysqld unless you fully understand the consequences and have backups.
Safer alternatives include:
- Restarting services via your init system, for example
systemctl restart php*-fpm, preferably during low traffic windows. - Temporarily blocking a specific IP or user agent at the web server or firewall level.
Rebooting in a panic vs reading a few key numbers first
Rebooting a VPS is simple, but it briefly takes everything offline and does not teach you what went wrong.
Before you reboot, take 30 to 60 seconds to record:
- The 1, 5 and 15 minute load averages.
- CPU idle and I/O wait percentages.
- RAM and swap usage.
- The top few processes by CPU and memory.
This small habit builds a history that makes future incidents far easier to understand. If you do decide to reboot, consider taking a snapshot first if your platform supports it, especially on production systems.
Setting up simple monitoring so top is not your only warning
Manually checking top is useful, but it is better to have independent alerts before customers notice a problem.
Basic monitoring can track:
- CPU utilisation and load average.
- RAM and swap usage.
- Disk space and disk I/O.
- Service availability (HTTP, HTTPS, MySQL).
Our article on simple server monitoring and alerts for Linux VPS outlines low‑maintenance options that suit non‑admins and small teams.
Summary: A Calm Checklist When top Shows High Load
When you next see high load or a slow server, you can work through this simple checklist:
- Log in with SSH and run
top. - Note the 1, 5 and 15 minute load averages and your number of CPU cores.
- Check CPU:
- Is
id(idle) near zero? You may be CPU‑bound. - Is
wa(wait) high? You may be I/O‑bound.
- Is
- Check RAM and swap:
- Is swap heavily used and growing? You may be RAM‑bound.
- Identify the top processes by
%CPUand%MEM. - Map processes to services: PHP, web server, MySQL, backups, cron jobs.
- Consider whether the load matches known activity (backups, campaigns) or indicates an underlying issue (plugin, query, configuration).
- Decide between:
- Short‑term actions (rescheduling backups, temporarily disabling heavy features).
- Medium‑term optimisation (caching, plugin review, query tuning).
- Long‑term scaling (more CPU/RAM, or moving to a managed environment).
If you prefer to focus mainly on your sites rather than the server details, it may be worth exploring G7Cloud virtual dedicated servers or Managed WordPress hosting, where performance tuning, monitoring and capacity planning are shared responsibilities rather than something you have to handle alone.