
Who This Log File Guide Is For (And What You Will Be Able To Do)
Typical situations where logs suddenly matter
If you run a VPS or virtual dedicated server, you may go for weeks or months without thinking about log files. Then something breaks and they suddenly become important.
Typical situations include:
- Your WordPress site starts returning “500 Internal Server Error”.
- WooCommerce checkout works for some customers but fails for others.
- The server feels slow, but CPU usage looks normal in your panel.
- You see spikes in traffic, or a security tool warns about attacks.
- A service such as nginx, Apache, MySQL or PHP-FPM will not start.
In all of these cases, the server usually knows more than it shows in the browser. That extra detail is written into log files.
What you will be able to do by the end
By the end of this guide you should be able to:
- Find the main Linux log directories on a typical VPS.
- Open and read logs without accidentally editing or deleting them.
- Watch logs in real time while you reproduce a problem.
- Locate Apache, Nginx and PHP logs that relate directly to website errors.
- Use
journalctlto view systemd logs for services like nginx and MySQL. - Spot obvious signs of brute force login attempts and noisy bots.
- Check how much disk space logs are using and clear them safely when needed.
The goal is not to turn you into a full-time system administrator, but to give you enough confidence with logs to investigate problems calmly and decide when you can fix something yourself and when it is better to ask for help.
If you are very new to SSH, you may find it useful to read our SSH access for beginners guide alongside this article.
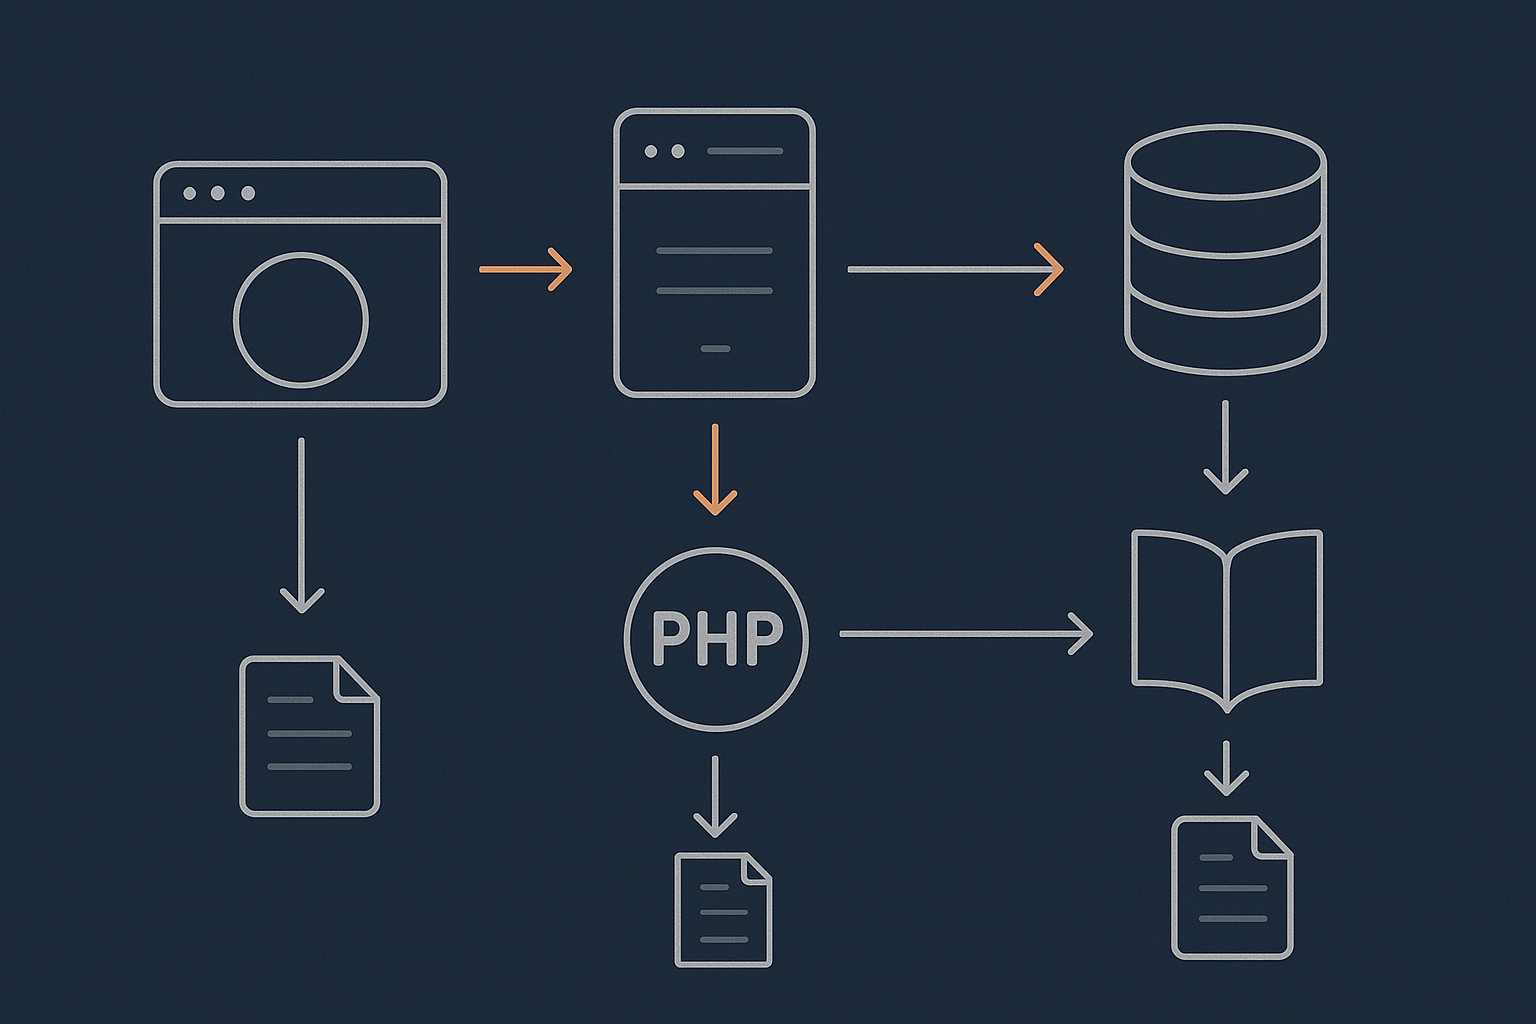
How Linux Logging Works in Plain English
What a log file actually is
A log file is simply a text file that an application or the operating system writes messages into over time. Each line is usually one “event”, for example:
- a web request hitting your site
- a PHP error when a script fails
- a user logging in via SSH
- a service starting, stopping or restarting
You can open log files with normal text tools like less or tail, and you do not need special software.
Key logging components: applications, syslog and the systemd journal
On a modern Linux VPS, logs usually come from three places:
- Applications such as nginx, Apache, PHP-FPM and MySQL write their own log files. For example,
/var/log/nginx/access.log. - syslog or rsyslog is a traditional logging service. It collects messages and writes files like
/var/log/syslogor/var/log/messages. - systemd journal is an in-memory and on-disk log managed by systemd. You read it with
journalctl. Many services log there as well as or instead of writing to files.
The exact setup differs slightly between distributions such as Ubuntu and AlmaLinux, but the principles are the same: services write messages, and a logging system stores them so you can read them.
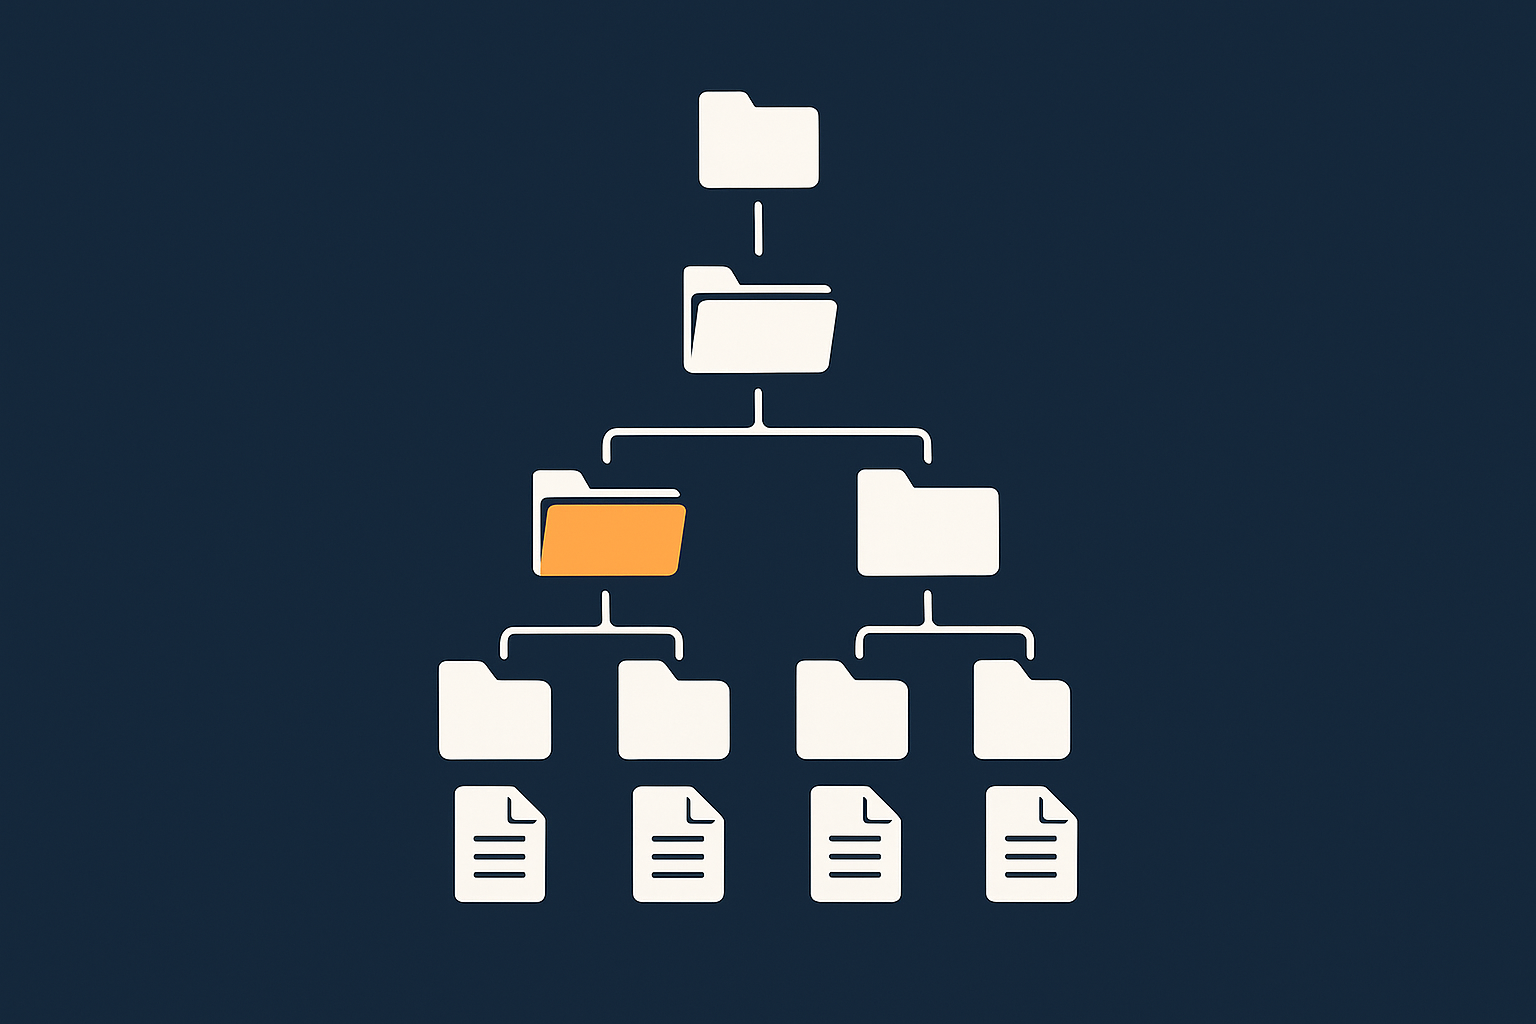
Where logs usually live on a VPS
Most traditional log files live in /var/log. Inside that directory you may see:
/var/log/syslogor/var/log/messagesfor general system messages./var/log/auth.logor/var/log/securefor authentication and SSH./var/log/apache2/or/var/log/httpd/for Apache./var/log/nginx/for Nginx./var/log/php*-fpm.logor similar for PHP-FPM.
On systemd-based systems, there is also the binary journal that you view with journalctl. You normally do not touch the journal files directly.
Safe First Steps: Connecting and Looking Around
Logging in with SSH and using sudo safely
Before you can look at logs, you will need SSH access. Typically you connect from your computer with a command similar to:
ssh username@your-server-ipThis simply opens a secure terminal session to your VPS. If SSH is new to you, our beginner SSH guide linked above walks through key concepts and safe habits.
Many log files are only readable by the root user. Rather than logging in directly as root, a safer pattern is to log in as a normal user and use sudo when you need elevated access.
For example, to run a command as root just once:
sudo whoamiThis asks for your password and then runs whoami as root. You should see:
rootUse sudo sparingly and only around the commands that truly need it, especially those that write to files, manage services or install software.
Navigating to /var/log and listing log files
The first safe step is simply to look at what is there without changing anything.
Change into the main log directory:
cd /var/logThis moves your current working directory to /var/log. You can confirm your location with:
pwdNow list the contents:
lsYou should see a list of log files and directories. Typical names include syslog, auth.log, nginx, apache2, php* and more.
To see more detail, including file sizes and timestamps:
ls -lhThis lists files with human readable sizes (for example, 24K, 2.1M). It is an easy way to spot which logs are growing large.
Safety notes: what not to delete or change
Log files are generally safe to read. Problems usually come from deleting, truncating or editing them without understanding the impact.
In particular:
- Do not run commands like
rm -rf /var/log/*. This can remove directories and files that services rely on and may stop logging entirely. - Avoid opening logs in text editors such as
nanoorvimunless you have a specific reason. It is easy to save accidental changes. - Do not change file permissions in
/var/logunless you know why. Incorrect permissions can leak sensitive data or stop services writing logs.
If you suspect logs are taking all your disk space, it is safer to pause and consult a guide such as What happens when a Linux server runs out of disk space than to delete files blindly.
The Essential Web Server Logs: Apache and Nginx
Finding your web server type and log locations
Most Linux web servers run either Apache or Nginx. To see which is installed, you can ask systemd:
sudo systemctl status apache2 nginx httpdThis checks the status of potential web server services. You might see something like:
● nginx.service - A high performance web server and a reverse proxy server
   Active: active (running) ...

● apache2.service
   Loaded: not-found (Reason: No such file or directory)
   Active: inactive (dead)
If nginx is active, your logs will usually be under /var/log/nginx/. If apache2 or httpd is active, log files are typically under /var/log/apache2/ (Debian/Ubuntu) or /var/log/httpd/ (CentOS/AlmaLinux/Rocky).
On some panels or custom setups, logs may live elsewhere. In that case, the web server configuration (for example, /etc/nginx/nginx.conf or a virtual host file) will reference the exact log paths.
Apache logs: access.log and error.log
Apache generally has at least two key logs:
- Access log: every HTTP request.
- Error log: problems and diagnostic messages.
On a typical Ubuntu server:
/var/log/apache2/access.log/var/log/apache2/error.log
To look at the end of the error log:
sudo tail -n 50 /var/log/apache2/error.logThis prints the last 50 lines so you can see the most recent messages. If you have just triggered a 500 error in your browser, you will often see matching entries here mentioning PHP errors, missing files or misconfigurations.
To browse the file interactively:
sudo less /var/log/apache2/error.logless allows you to scroll with the arrow keys, Page Up, Page Down, and to search with / followed by a pattern (such as a domain name or IP). Press q to exit. This does not change the file; it is safe to use.
Nginx logs: access.log and error.log
Nginx uses a similar pattern:
/var/log/nginx/access.log/var/log/nginx/error.log
On a busy site, access.log can grow quickly, because it records every request. To see only recent requests:
sudo tail -n 50 /var/log/nginx/access.logTo focus on errors:
sudo tail -n 50 /var/log/nginx/error.logThe error log is usually more helpful when debugging 500 errors, gateway timeouts and configuration issues.
Reading logs in real time with tail and less
When reproducing a problem, it is useful to watch the log as new lines are written.
To follow a log in real time:
sudo tail -f /var/log/nginx/error.logThis shows the last lines and then waits. When you refresh your website or repeat the problematic action in the browser, new log entries will appear instantly. Press Ctrl + C to stop following.
A couple of useful variations:
tail -n 100 -ffollows the log but starts with the last 100 lines for context.- You can use the same pattern for Apache logs, for example
sudo tail -f /var/log/apache2/error.log.
None of these commands modify the logs. They only read and display them.
Common problems you can spot in web server logs
Some issues show clear patterns in web server logs:
- Repeated 404s for missing URLs, which may indicate broken links or bots scanning for vulnerable paths.
- 5xx status codes such as 500 or 502, often pointing to PHP or upstream issues.
- Timeouts where an upstream (for example PHP-FPM) is too slow and nginx logs gateway timeout errors.
- Client IPs making huge numbers of requests, potentially indicating abusive traffic or a simple flood.
If you are using the G7 Acceleration Network, much of the abusive or non human traffic can be filtered before it reaches your PHP application. That keeps your access and error logs cleaner and helps you focus on real user problems.
PHP and Application Logs: Tracking Down 500 Errors and White Screens
Where PHP-FPM and PHP error logs usually live
HTTP 500 errors and “white screen of death” problems in WordPress often come from PHP errors that do not show directly in the browser for security reasons. Instead, they are logged.
On PHP-FPM based setups you might see logs like:
/var/log/php7.4-fpm.log/var/log/php8.1-fpm.log/var/log/php-fpm/error.logon some CentOS/AlmaLinux systems
To find PHP-FPM logs, you can list files with “php” in their names:
ls -lh /var/log | grep phpIf you see a candidate such as php8.1-fpm.log, view the end with:
sudo tail -n 50 /var/log/php8.1-fpm.logLook for entries mentioning “PHP Fatal error”, “Parse error” or “Uncaught Exception”. These often point directly to a plugin, theme or specific file.
Enabling WordPress debug logging when needed
Sometimes the PHP-FPM logs are not detailed enough, or a shared hosting style configuration sends errors elsewhere. WordPress has its own debug log mechanism.
Caution: Editing wp-config.php should be done carefully and ideally in a staging or non production environment first. Always take a backup of the file before changing it.
To enable WordPress debug logging:
- Connect via SSH or SFTP.
- Edit
wp-config.phpin the site root. - Find the line that says
/* That's all, stop editing! Happy publishing. */. - Add these lines just above it (adjusting if
WP_DEBUGis already defined):
define( 'WP_DEBUG', true );
define( 'WP_DEBUG_LOG', true );
define( 'WP_DEBUG_DISPLAY', false );
This tells WordPress to log errors to wp-content/debug.log without showing them on screen. That is useful on production sites.
Reproduce the problem (for example, load the page that shows a 500 error), then inspect the log:
cd /path/to/your/site
sudo tail -n 50 wp-content/debug.log
You should see any new errors that occurred while the problem was reproduced, often with clear references to the plugin or theme involved.
Important: Once you are done debugging, it is best to switch debug logging off again to avoid log growth and exposing extra detail if misconfigured. Set WP_DEBUG back to false or remove the lines you added.
Following PHP errors in real time while reproducing a problem
To watch PHP errors as they happen, you can follow the relevant log:
sudo tail -f /var/log/php8.1-fpm.logor, for WordPress debug:
cd /path/to/your/site
sudo tail -f wp-content/debug.log
Leave this running in your terminal and then use your browser to trigger the problematic action, such as submitting a WooCommerce checkout or visiting an admin page. Errors should appear in real time and are often much more descriptive than a generic 500 page.
Common PHP and WordPress issues you will see in logs
Some frequent patterns in PHP and WordPress logs include:
- Fatal errors due to missing classes or functions after a plugin or theme update.
- Out of memory errors indicating that PHP memory limits are too low for a particular operation.
- Database connection errors showing password or hostname issues.
- Deprecated warnings that do not normally break the site but suggest future compatibility issues.
If you run only one or two business sites and do not want to spend much time at this level, a platform such as Managed WordPress hosting or WooCommerce hosting can take care of much of the PHP layer for you, including monitoring and updates.
System Logs with systemd: When Services or the Whole Server Misbehave
What the systemd journal is
On modern Linux distributions, systemd is responsible for starting services and keeping track of their status. It also maintains a structured log called the journal.
Many services log directly into the journal. Instead of reading a file under /var/log, you use journalctl to query messages. This is especially useful for services that do not keep separate text log files.
Using journalctl to view service specific logs (nginx, php-fpm, mysql)
To see recent messages from a specific service, use the -u (unit) option. For example, to inspect nginx:
sudo journalctl -u nginx --since "1 hour ago"This shows all nginx related logs from the last hour. You can adjust the time range, for example --since "today" or --since "2025-01-01".
To follow logs in real time, similar to tail -f:
sudo journalctl -u nginx -fOther useful examples:
sudo journalctl -u php8.1-fpm -fsudo journalctl -u mariadb -formysql, depending on your database service name
This is particularly helpful immediately after restarting a service. If a configuration error prevents it from starting, the journal will usually show why.
For more depth on service management, see our guide on understanding and managing Linux services with systemd.
Checking boot and shutdown messages when the VPS feels unstable
If your VPS reboots unexpectedly or feels unstable, boot logs can provide clues.
To see messages from the previous boot:
sudo journalctl -b -1Here -b -1 means “the boot before the current one”. Without arguments, journalctl -b shows logs from the current boot.
Look for repeated hardware or storage errors, kernel panics or OOM (Out Of Memory) kill messages. These may indicate resource limits or underlying hardware issues that you might want to discuss with your hosting provider.
Security and Access Logs: SSH, Auth and Suspicious Traffic
Finding SSH and authentication logs (auth.log, secure)
Authentication logs track login attempts, including SSH. The exact file differs by distribution:
- Debian/Ubuntu:
/var/log/auth.log - CentOS/AlmaLinux/Rocky:
/var/log/secure
To view recent entries:
sudo tail -n 50 /var/log/auth.logor:
sudo tail -n 50 /var/log/secureHere you will see both successful and failed login attempts, including sudo usage, SSH logins and sometimes other privileged operations.
Spotting repeated login failures and brute force attempts
It is common to see automated bots trying to guess passwords. They often show in the auth log as a series of “Failed password” messages from the same IP.
To filter for failed SSH logins on Ubuntu:
sudo grep "Failed password" /var/log/auth.log | tail -n 50This searches for lines containing “Failed password” and shows the last 50 matches. You can increase the number for a broader view.
On CentOS-like systems:
sudo grep "Failed password" /var/log/secure | tail -n 50Seeing occasional failures is normal. Large bursts, or attempts across many different usernames, may justify tightening SSH security, for example by using key based authentication and disabling password logins.
Relating log entries to tools like Fail2ban and WAF rules
Security tools such as Fail2ban read logs, detect repeated failures and then block offending IPs at the firewall level. If Fail2ban is installed, you may see its decisions in the same auth logs or in dedicated log files such as /var/log/fail2ban.log.
Similarly, web application firewalls (WAF) may log blocked or challenged requests for WordPress and other sites. These can appear in separate mod_security logs or in your web server’s error logs, often marked clearly as blocked by a rule.
If you use the G7 Acceleration Network, its bot protection filters a large amount of abusive or non human traffic before it hits PHP or the database. That reduces unnecessary load and keeps your server logs more focused on real user traffic and genuine issues.
Practical Log-Driven Troubleshooting Examples
Example 1: WordPress site showing 500 errors
Steps you might take:
- Reproduce the error in your browser and note the time.
- Check your web server error log around that time using
tail -f.
sudo tail -f /var/log/nginx/error.logor:
sudo tail -f /var/log/apache2/error.log- If the error mentions PHP or is vague, check PHP-FPM logs.
sudo tail -f /var/log/php8.1-fpm.log- If needed, temporarily enable WordPress debugging to capture more detail in
wp-content/debug.log. - Identify whether it is tied to a specific plugin, theme, or custom code, then temporarily disable the suspected component and test again.
Keep a note of the changes you make, including any files edited and plugins disabled, so you can reverse them if necessary.
Example 2: WooCommerce checkout intermittently failing
Intermittent issues are harder to reproduce, but logs still help.
- Ask an affected user (or yourself in a test account) to reproduce the failure and note exact times and order numbers.
- Watch the PHP-FPM and web server logs in real time during a test purchase.
sudo tail -f /var/log/php8.1-fpm.logand in a second window:
sudo tail -f /var/log/nginx/error.log- Look for errors around payment gateway callbacks, AJAX requests or specific PHP scripts.
- If an external API is slow, you might see timeouts or errors mentioning HTTP requests that fail.
- Once you have a pattern, you can bring concrete log excerpts to your payment provider or developer, which makes it easier for them to help.
Example 3: High load or slow server with no obvious cause
When the server feels slow but standard CPU graphs do not show much, you can combine monitoring tools with logs.
- Use tools like
toporhtopto see which processes are busy. Our guide on monitoring a Linux web server with built-in tools covers this. - Check web server access logs for surges in traffic or many requests from a single IP.
sudo tail -n 200 /var/log/nginx/access.log- Review system logs for disk or memory pressure.
sudo journalctl -b | grep -i "out of memory"- Look at database logs if MySQL or MariaDB is involved, watching for slow queries or connection issues.
If you consistently hit resource limits, you may need to tune services, add caching or consider scaling up. For sites with large bursts of traffic, the G7 Acceleration Network can help by offloading static content and optimising images into AVIF and WebP on the fly, which reduces bandwidth and CPU work without requiring changes to WordPress plugins.
Keeping Log Files Under Control: Rotation and Disk Space
What log rotation is (logrotate and systemd-journald limits)
Log files grow over time. To avoid them filling the disk, Linux uses log rotation. This means:
- At set intervals or when a file reaches a certain size, it is “rotated” to a new name such as
error.log.1,error.log.2.gzand so on. - Older logs are compressed or deleted after a defined period.
logrotate controls rotation for traditional text logs, with configuration under /etc/logrotate.conf and /etc/logrotate.d/. The systemd journal has its own size and time limits, managed by systemd-journald and its configuration file, usually /etc/systemd/journald.conf.
If you adjust these, make small, deliberate changes and keep notes. It is also wise to test changes on a non production server where possible.
Checking how much space logs are using
To see the size of the /var/log directory:
sudo du -sh /var/logThis summarises the total size. To see which subdirectories are largest:
sudo du -sh /var/log/* | sort -hThis prints each item in /var/log with its size, sorted from smallest to largest. It is a simple way to find a single log or service that is consuming most of the space.
For journal size specifically:
sudo journalctl --disk-usageThis reports how much space the systemd journal is using and the limit configured.
Safe ways to clear space when logs get too big
If logs are taking significant space, a few safe approaches include:
- Rely on log rotation: ensuring logrotate is working correctly is the first step.
- Adjust logrotate settings for especially noisy logs to keep fewer compressed copies or rotate more frequently.
- Vacuum the systemd journal rather than deleting files manually.
To reduce journal size to, for example, 500 MB:
sudo journalctl --vacuum-size=500MThis instructs systemd to keep only enough journal data to stay within that size, removing older entries first. It does not affect current logging.
With text logs, you can trigger logrotate to run immediately:
sudo logrotate -f /etc/logrotate.confCaution: Be careful with manual deletion (rm) in /var/log. Removing the wrong files or directories can cause services to fail to write logs until restarted or reconfigured. If in doubt, consult a more detailed disk usage and recovery guide before deleting anything.
Our article on what happens when a Linux server runs out of disk space provides a step by step approach to safely recovering from a full disk situation.
When to ask for help or consider managed VDS
Managing logs is only one part of running an unmanaged VPS or virtual dedicated server. You are also responsible for system updates, security hardening, performance tuning and capacity planning.
It can be sensible to ask for help or move to a managed environment if:
- You frequently run into log related disk issues and are not comfortable tuning rotation and storage.
- You are spending more time debugging than supporting your actual business or projects.
- Your site is critical and downtime has a direct financial impact, for example on WooCommerce sales.
Managed virtual dedicated servers allow you to keep the flexibility of a dedicated environment while offloading much of the day to day operational risk, including log and capacity management.
Building a Simple Logging Habit (Without Becoming a Sysadmin)

A basic checklist whenever there is a problem
You do not need to check logs every day. However, when something goes wrong, a simple, repeatable process helps.
For most issues, you can follow this checklist:
- Note the exact time and symptoms, including URLs, error messages and affected users.
- Check the relevant application logs:
- Web server error logs for HTTP errors.
- PHP-FPM and WordPress debug logs for application issues.
- Database logs if data queries seem slow or failing.
- Look at system and journal logs if services are failing or the whole VPS is unstable.
- Review security logs if you suspect login abuse or attacks.
- Record what you find and what you change in a simple text file or ticket system.
This habit makes it easier to spot patterns over time and to share clear information if you later ask a specialist or support team for help.
How logs fit with monitoring, alerts and managed hosting
Logs are excellent for detailed investigation but are reactive by nature. For a more proactive approach, basic monitoring and alerts can tell you when something is wrong before users complain.
Simple monitoring can track:
- CPU, memory and disk usage
- Uptime and response time for key URLs
- Specific log patterns or error rates
Our guide on server monitoring for non-admins covers how to set up practical alerts without becoming a full-time administrator.
Managed hosting, whether for WordPress or at the virtual dedicated server level, typically includes some combination of monitoring, log review and proactive response. That means you can still dip into logs when you want to understand an issue, but you are not solely responsible for catching and resolving every incident yourself.
Next steps: going deeper into server basics and troubleshooting
If you have followed this guide through and tried some of the commands on a test or non critical server, you now have a solid foundation in Linux logs. Natural next steps include:
- Exploring our article on logging and error monitoring for WordPress and WooCommerce for a deeper application-level view.
- Practising with systemd tools for managing and troubleshooting services.
- Combining logs with performance monitoring to understand how your server behaves under load.
If you would prefer to focus on your sites or applications rather than the underlying server, you may find that our managed virtual dedicated servers or Managed WordPress hosting are a good fit. They allow you to keep access to logs and control where you want it, while our team handles the routine operational work.
Whichever route you choose, having a calm, practical understanding of your log files will make every future troubleshooting session easier.