

Who This Monitoring Guide Is For (And What You Will Be Able To Do)
This guide is for anyone running a Linux web server who wants to understand what is happening when a site feels slow, without immediately upgrading hosting or installing complex monitoring stacks.
You might be on a small VPS, a larger virtual dedicated server, or even a bare‑metal machine. The commands are the same.
Typical situations where you need basic Linux monitoring
Some common scenarios:
- Your WordPress or WooCommerce site feels slow during busy times and you want to know if it is really “server load”.
- Support or your developer asks for “CPU load”, “memory usage” or “I/O stats” and you are not sure how to get them.
- You suspect a backup job, malware scanner or cron task is slowing things down, but you need evidence.
- You are planning to move to a bigger plan and want to check whether you actually need more CPU, RAM or faster storage.
What you will be able to read and decide by the end
By the end of this article you will be able to:
- Log in over SSH and run monitoring commands safely.
- Use
topandhtopto see live CPU, memory and process activity. - Use
iotopto see who is hammering your disk. - Use
ssto see network ports and active connections. - Use
sarto look back in time and see how busy your server was earlier in the day or week. - Follow a simple checklist when your site feels slow so you can say “it is CPU” or “it is disk I/O” with confidence.
We will stick to built‑in or very standard tools that are available on almost all distributions.
Safe First Steps: Connecting and Looking Without Breaking Anything
Logging in over SSH safely
Recap: using ssh from your computer to the server
To run any of these tools, you first connect to your server over SSH from your local computer. A typical command from macOS, Linux or Windows Terminal looks like:
ssh username@your-server-ipThis command:
- Opens an encrypted connection to your server.
- Logs you in as
username, which should be a normal user where possible.
You will be asked for your password or your SSH key will be used automatically, depending on how access is set up. If SSH itself is new to you, it is worth reading the dedicated guide SSH Access for Beginners: Safe First Login and Day‑to‑Day Use on Your VPS before going further.
Why you should avoid logging in as root directly
On many servers you can log in as root, but it is usually safer to log in as a normal user and then elevate temporarily when needed with sudo. This reduces the chance of running a dangerous command by accident.
For the tools in this guide:
top,htopandssare generally fine as a normal user.iotopand fullsardata often requiresudoprivileges to see all processes and counters.
When you see a command prefixed with sudo below, it means “run this with administrator privileges”. You will be asked for your password and the action will be logged on the server.
Read‑only mindset: commands that only observe vs commands that change things
A good habit is to separate “look” commands from “change” commands.
Commands in this guide that are safe to run
The following commands are read‑only: they watch and report, but do not change server configuration or delete data:
tophtop(until you actively choose an action such as kill)iotop(monitoring mode)sssar
These are all safe to run on a production server, even during busy times, as long as you do not use their “kill” or “restart” functions.
Common dangerous actions to avoid while troubleshooting
While you are learning, avoid:
kill -9anything unless you are sure what it is.rmon system directories such as/etc,/var,/usr.- Editing web server, database or PHP configs without a backup.
- Restarting services like Apache, Nginx, PHP‑FPM or MySQL during peak business traffic unless you understand the impact.
Before big changes, especially on business‑critical sites, consider taking a snapshot if your provider offers it. If you are using a managed service like G7Cloud’s virtual dedicated servers, you can often ask support to review changes or apply them for you.
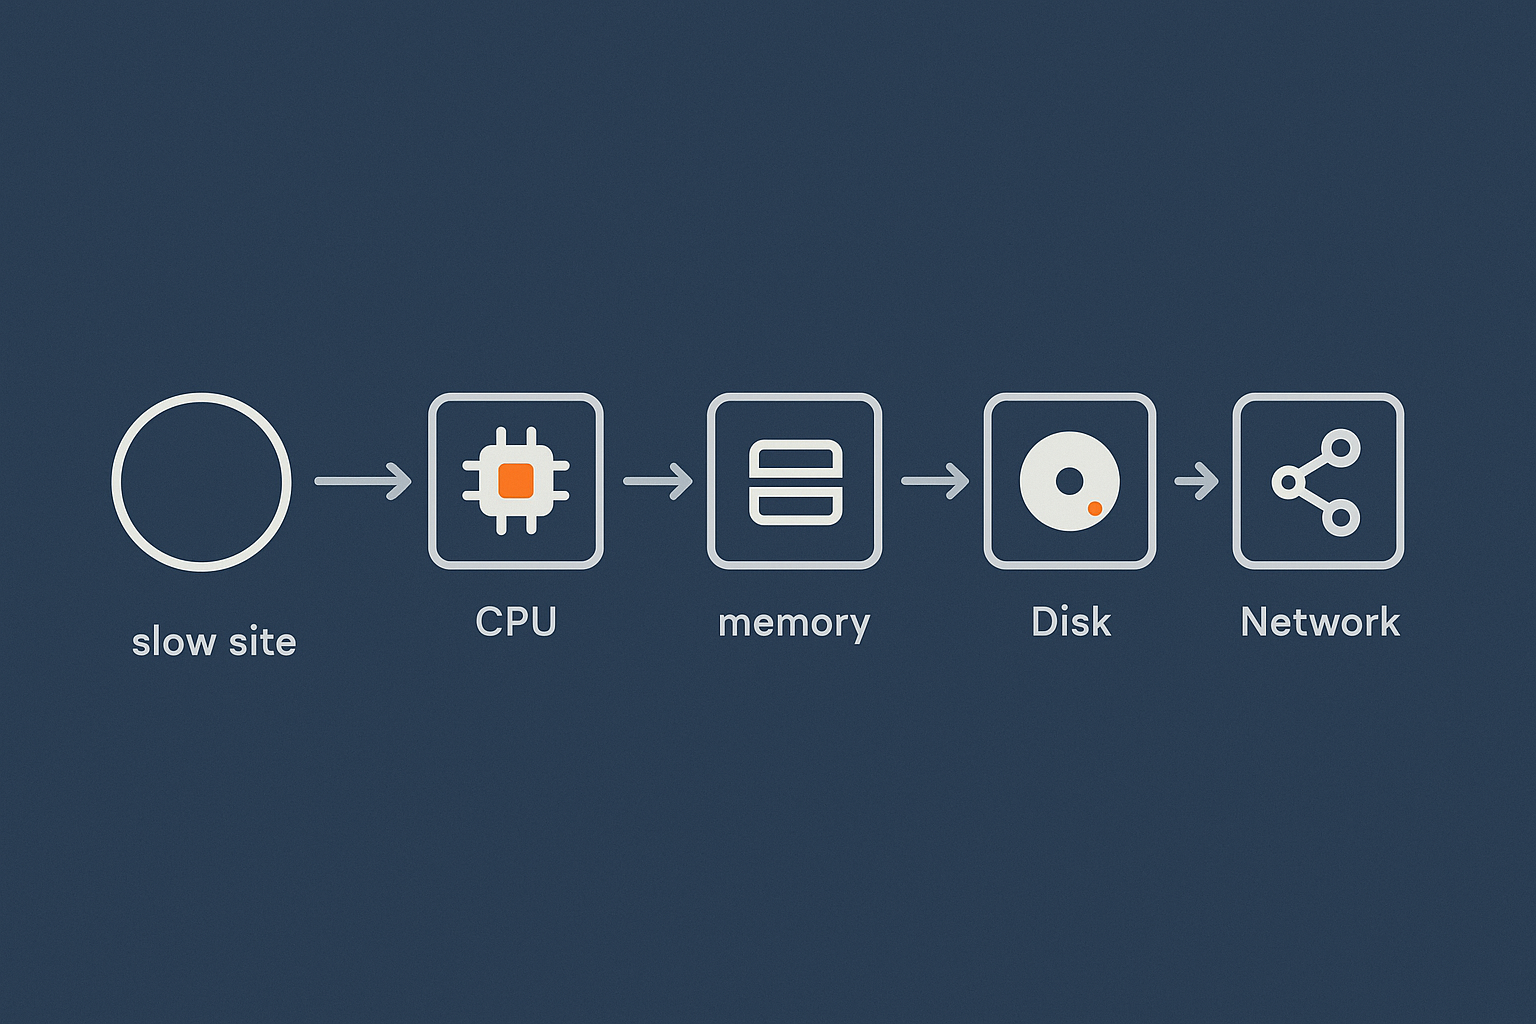
The Four Main Things to Watch on a Web Server

Every Linux web server is limited by four main types of resource:
- CPU
- Memory (RAM and swap)
- Disk I/O
- Network
Most performance issues are one of these, or a combination.
CPU: how busy your processors really are
CPU measures how much processing power is being used. On a web server this often comes from:
- PHP (WordPress, WooCommerce and other apps).
- Database queries (MySQL or MariaDB).
- Background jobs and workers.
When CPU is consistently high, requests queue up and pages can feel slow. top and htop help you see this live, and sar helps you see patterns over time.
Memory: free RAM vs cache vs swap in plain English
Linux uses RAM in three main ways:
- Program memory: what running processes are actually using.
- File cache: recently read files kept in memory so they can be served more quickly next time.
- Swap: slow “overflow” space on disk when RAM is full.
New admins often worry when “free RAM” is low, but Linux intentionally uses RAM as cache to speed things up. A better sign of memory trouble is:
- High and growing swap usage.
- Constantly high “swap in/out” or “page in/out” counts.
- Processes being killed by the OOM (out‑of‑memory) killer in logs.
top, htop and sar all show memory and swap behaviour.
Disk I/O: when storage becomes the bottleneck
Disk I/O is how quickly your server can read from and write to storage. It matters for:
- Database queries that cannot be served from memory.
- Log files that are constantly written.
- Backups, malware scans and indexing jobs.
If disk is too slow or too busy, everything built on top of it will feel sluggish, even when CPU looks fine. iotop helps you see who is using disk heavily.
Network and connections: whether visitors can actually talk to your server
The network covers everything from your server’s public IP and open ports through to individual connections from visitors. Common questions:
- Is my server listening on ports 80 and 443 for HTTP and HTTPS?
- How many connections are active now?
- Is one IP opening hundreds of connections?
ss lets you inspect this in detail.
How these relate to WordPress and WooCommerce symptoms
On WordPress and WooCommerce sites you might see symptoms like:
- Slow page loads during a sale or campaign: often CPU or database.
- Admin dash painfully slow while the front end is “okay”: can be CPU, memory or poorly performing plugins.
- Site pauses or timeouts when backups run: usually disk I/O.
- Intermittent connection errors: sometimes network or firewall limits.
The rest of this guide helps you connect those symptoms with what the server is actually doing.
Using top: Your First Live View of CPU and Memory
How to start and exit top safely
Basic command
top is installed by default on virtually all Linux systems. To start it, simply run:
topWhat happens:
- Your terminal switches to a live, updating view of processes.
- The display refreshes every few seconds.
Nothing is changed on the server. You are only observing.
Keyboard shortcuts to quit and sort
Within top some useful keys are:
q: quit and return to the normal shell.P: sort processes by CPU usage (highest first).M: sort by memory usage.1: toggle detailed CPU view (per core).
If you ever feel “stuck” in top, press q to exit.
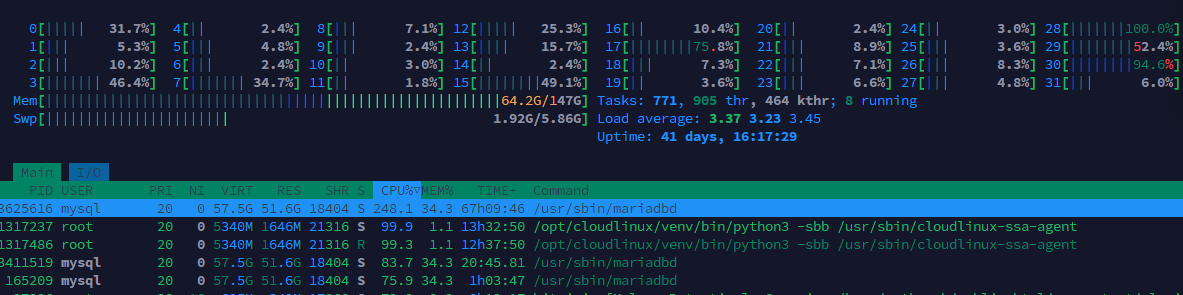
Reading the top summary line by line
The top few lines of top provide a summary of your system. Let us break them down.
Load average: what those three numbers actually mean
Near the top you will see something like:
load average: 0.50, 0.70, 0.60These are averages of how many tasks were waiting to run over the last 1, 5 and 15 minutes. Roughly:
- On a 1‑CPU system, a load of 1.0 means “fully busy but not overloaded”.
- On a 4‑CPU system, a load of 4.0 is similar.
Rule of thumb:
- If load is below the number of CPU cores, the system is probably coping.
- If load is consistently several times higher than core count, you likely have CPU, disk or other contention issues.
You can see your CPU core count with:
nprocThis simply prints how many processing units the kernel sees.
CPU usage breakdown: user, system, iowait
Another line in top shows CPU usage as a percentage, for example:
%Cpu(s): 5.0 us, 2.0 sy, 0.0 ni, 90.0 id, 3.0 wa, 0.0 hi, 0.0 si, 0.0 stIn plain English:
us(user): normal application work, including PHP.sy(system): kernel work such as networking and disk.id(idle): free CPU.wa(iowait): CPU is idle but waiting on disk I/O.
If wa is high and your site is slow, it suggests storage is the bottleneck. If us is high, your applications are keeping CPUs busy.
Memory and swap: when high usage is normal and when it is a problem
Top also shows memory like this:
MiB Mem :  3943.5 total,   120.0 free,  2500.0 used,  1323.5 buff/cache
MiB Swap:  2047.0 total,  1900.0 free,   147.0 used.   900.0 avail Mem
Two important ideas:
buff/cacheis Linux using spare RAM to cache files. This is normal and helps performance.avail Mem(available memory) is a better indicator of “how much RAM is left” thanfree.
Concern signs:
- Swap usage growing steadily during normal use.
- Very low “avail Mem” together with high swap.
In that case, either a process is leaking memory, or you may simply need more RAM for your workload.
Finding heavy processes that affect your site
Sorting by CPU and memory
In the lower part of top you see one line per process. To find heavy ones:
- Press
Pto sort by CPU usage. - Press
Mto sort by memory usage.
Look for processes sitting near the top for a long time, especially under load.
Recognising PHP‑FPM, Apache, Nginx and MySQL processes
Typical web‑related processes will appear as:
php-fpmorphp-fpm7.x: PHP FastCGI process manager, used by many WordPress setups.apache2orhttpd: Apache web server.nginx: Nginx web server.mysqldormariadbd: MySQL or MariaDB database.
If one of these is consistently at the top during slow periods, you know where to investigate. Our article How to Troubleshoot High CPU and Memory Usage on WordPress (Before You Upgrade Hosting) goes into application‑level fixes for these cases.
When to avoid killing processes
top allows you to kill processes using k, but it is better to avoid this unless you know exactly what you are stopping.
Risks include:
- Terminating your main web or database daemon and taking the site offline.
- Interrupting backups or system updates part‑way through.
Use top to observe and record first. If something looks suspicious (for example a runaway script), consider checking with your developer or host, especially on production workloads.
Using htop: A Friendlier Process Viewer
htop is like top with a nicer, more visual interface. It lets you scroll, filter and see processes grouped into trees.
Installing htop if it is not already present
Commands for common distributions (Ubuntu / Debian / CentOS / AlmaLinux / Rocky)
First, check if htop is installed:
htopIf the command is not found, install it using your distribution’s package manager. These commands need sudo because they change the system by installing software.
- Ubuntu / Debian:
sudo apt update
sudo apt install htop- CentOS 7:
sudo yum install epel-release
sudo yum install htop- AlmaLinux / Rocky Linux / CentOS Stream 8+:
sudo dnf install htopTo “undo” this, you could remove the package later with sudo apt remove htop or the equivalent for your distro, but htop is lightweight so most people keep it installed.
Reading the htop interface
Coloured CPU, memory and swap bars
Run:
htopAt the top you will see coloured bars for CPU, memory and swap. These give a quick sense of load without reading numbers:
- Short bars: resource is mostly free.
- Long, consistently full bars: resource is tight.
The colour key varies slightly between distributions, but generally user CPU is one colour, system CPU another, and iowait is often highlighted.
Tree view vs flat list: seeing which processes belong together
By default, htop often shows a “flat list” sorted by CPU. Press F5 (or click “Tree”) to switch to tree view. This is very useful to:
- See which worker processes belong to which parent (for example, PHP‑FPM children under the main
php-fpmprocess). - Understand how services are structured.
You can toggle back to a flat list with F5 again, and quit htop at any time with F10 or q.
Practical uses of htop on a web server
Spotting runaway PHP or cron jobs
Use htop during or just after a slow period to look for:
- PHP processes using very high CPU for a long time.
- Cron jobs (often
phpor shell scripts) that never seem to finish.
You can press F3 in htop to search for names like php or cron and quickly find related processes.
Watching load during a traffic spike or WooCommerce sale
During a campaign or sale, having htop open gives you a live feel for whether your server is coping:
- CPU bars stay moderate: server is handling traffic well.
- CPU and load averages spike and stay high: you may be at capacity.
- Swap usage bar grows: RAM is tight and you are spilling to disk.
This is helpful when deciding whether to optimise, tune configuration or consider a larger VPS or VDS. Our article Practical Capacity Planning for VPS and VDS shows how to turn these observations into upgrade decisions.
Safe actions: filtering, searching, and when to use F9 (kill)
In htop the safest features are:
- Sorting by different columns by clicking headers or using
F6. - Searching (
F3) for process names. - Filtering (
F4) to show only certain processes, such asphp-fpm.
F9 (kill) sends a signal to terminate a process. Use it sparingly:
- Prefer asking your developer or host before killing core services such as web servers or databases.
- If you do need to kill something, start with the default
TERMsignal instead ofKILL, which is more forceful.
Using iotop: Seeing Which Processes Are Hammering Your Disk
What disk I/O is and why it matters for WordPress and databases
Disk I/O is how intensively your server reads and writes data. Web workloads hit disk for:
- Database tables that are not cached in RAM.
- PHP sessions and temporary files.
- Access logs and error logs.
- Backups and malware scans.
When disk I/O is saturated, you might see high iowait in top and sluggish responses even if CPU is not maxed out. iotop helps pinpoint which processes are causing this.
Installing iotop and running it with the right permissions
Package installation commands
iotop is usually not installed by default. To add it:
- Ubuntu / Debian:
sudo apt update
sudo apt install iotop- CentOS 7:
sudo yum install iotop- AlmaLinux / Rocky / CentOS Stream 8+:
sudo dnf install iotopAgain, these commands modify the system by installing a package. Removing is as simple as sudo apt remove iotop or the equivalent if you no longer need it.
Running iotop and exiting cleanly
To see live disk activity across all processes you usually need root privileges:
sudo iotopThis opens a refreshing display similar to top. To exit, press q.
If you prefer a snapshot instead of a live view, you can run:
sudo iotop -b -n 5This runs in “batch mode” and prints 5 updates to the terminal, then exits. It can be useful for saving output into a file for later review, for example:
sudo iotop -b -n 5 > iotop-snapshot.txtReading iotop output in plain English
DISK READ, DISK WRITE and IO
At the top of iotop you will see summary lines like:
Total DISK READ: 10.00 M/s | Total DISK WRITE: 20.00 M/sBelow that, each process has columns such as:
- DISK READ: how fast this process is reading from disk.
- DISK WRITE: how fast it is writing.
- IO%: how much of the time this process is waiting on I/O.
Look for processes with consistently high DISK READ or WRITE, especially during slow periods.
Identifying MySQL, backup jobs and log rotations
Common disk‑heavy processes include:
mysqldormariadbdwhen the database is under load.- Backup tools such as
tar,rsyncor specific backup software. - Malware scanners (ClamAV and similar) walking through files.
- Log rotation (
logrotate) compressing and rotating old logs.
When a slow period matches heavy I/O from these, tuning or rescheduling them may solve the problem without more hardware.
Common disk‑related problems and what iotop can confirm
Backups or malware scanners causing slow sites
If your site slows at the same time each day or week, run sudo iotop during that window. If you see backup or scanning processes dominating disk, consider:
- Rescheduling heavy jobs to quieter times.
- Reducing their intensity or scope.
On shared or busy environments, offloading some tasks to a separate server or remote backup target can also help.
Swap thrashing on small VPS plans
On small VPSs, if RAM is tight the system may start using swap heavily. This can show up in iotop as constant disk activity, even when the database is quiet.
If top shows high swap usage and iotop shows constant general I/O, you may be “swap thrashing” where the system spends most of its time shuffling data between RAM and disk. The long‑term fix is usually more RAM or optimising application memory usage.
Using ss: Checking Network Connections and Ports
What ss does and why it replaced netstat on modern Linux
ss is a modern replacement for netstat. It inspects sockets, which are the endpoints for network communication on your server.
You can use ss to answer questions such as:
- Which ports is my server listening on?
- How many connections are currently established?
- Are many connections coming from a single IP?
Basic ss commands for a web server
Checking which ports are listening (web, SSH, database)
To see listening TCP ports and the associated processes:
sudo ss -tulnpExplanation:
-t: TCP sockets.-u: UDP sockets.-l: listening sockets.-n: show port numbers rather than service names.-p: show process using the socket.
You should see entries such as:
- Port 22: SSH.
- Port 80: HTTP.
- Port 443: HTTPS.
- Sometimes 3306: MySQL, which should usually be bound to
127.0.0.1(localhost) rather than publicly exposed.
Seeing active connections to your web server
To see current TCP connections to ports 80 and 443, run:
sudo ss -tn state established '( sport = :80 or sport = :443 )'This says “show established TCP connections where the source port is 80 or 443”. On a busy site you may see many entries, one per client connection.
If you want a quick count per remote IP, you can use:
sudo ss -tn state established '( sport = :80 or sport = :443 )' \
| awk 'NR>1 {print $5}' | cut -d: -f1 | sort | uniq -c | sort -nr | headThis combines ss with standard text tools to show which IPs have the most connections. Do not worry if you cannot remember the full pipeline; the key idea is that patterns of many connections from one IP can be spotted.
Spotting unusual or abusive traffic patterns
Many connections from a single IP
If a single IP has hundreds of connections, it could be:
- A misconfigured crawler or API client.
- A monitoring tool hitting you too frequently.
- Abusive or non‑human traffic.
In these cases you may wish to rate‑limit or block that IP using your firewall or web server rules.
Long‑lasting connections that never close
Some web applications use long‑lived connections (for example WebSockets), but on a typical WordPress site most connections are short. If you see many connections stuck in the same state for a long time, something may be wrong with a proxy, firewall or upstream connection.
Where network‑level protection or a CDN can help
If abusive traffic is common or heavy, network‑level protection in front of your server can help filter it before it reaches PHP or the database. Services like the G7 Acceleration Network provide web hosting performance features that include bot protection, so suspicious or obviously non‑human traffic is filtered before it consumes CPU or memory.
Using sar: Historical Performance Data Without Extra Software
So far we have looked at live tools. They are great during an incident, but what if the problem happened overnight? That is where sar comes in.
What sar and sysstat are in plain language
sar is part of the sysstat package. It collects resource usage snapshots at regular intervals and stores them in binary log files. You can then query those logs later to see CPU, memory and I/O history.
In other words, sar is a simple, built‑in way to get graphs and history without installing a full monitoring system.
Installing and enabling sysstat collection
Package installation commands by distribution
To add sysstat:
- Ubuntu / Debian:
sudo apt update
sudo apt install sysstat- CentOS / AlmaLinux / Rocky:
sudo yum install sysstat   # CentOS 7
sudo dnf install sysstat   # AlmaLinux / Rocky / CentOS Stream 8+
This installs the tools and usually configures default collection intervals. If you uninstall sysstat later, existing historical data files may remain in /var/log/sysstat until you delete them.
Ensuring the sysstat service or cron is active
On systemd‑based systems, enable and start the service:
sudo systemctl enable sysstat
sudo systemctl start sysstatOn some distributions, data collection is controlled via cron and a config file in /etc/default/sysstat or /etc/sysconfig/sysstat. If you see a line like ENABLED="false", you can change it to true and restart the service or cron job. Always keep a note of such changes for future reference.
Reading historical CPU, memory and I/O usage
After sysstat has been running for at least a few hours, you can query the data. By default, sar without arguments prints today’s CPU stats:
sarChecking CPU usage over the day
To see CPU usage every 10 minutes for today:
sar -u 10This does not change anything. It simply reads existing logs and prints time‑stamped rows showing user, system and idle CPU percentages. Look for times when idle is low and user/system are high, which may match reported slow periods.
Checking memory, swap and I/O trends
To see memory usage:
sar -r 10Key columns include used and free memory and swap. For swap activity and paging:
sar -W 10For block device (disk) I/O:
sar -d 10These provide a history of when disk was busiest and when swap activity spiked. You can also query previous days using the -f option and a filename in /var/log/sysstat/; see man sar or the official sysstat documentation for details.
Relating sar data to slow periods in WordPress or WooCommerce
When customers say “the site was slow at 10:30 this morning”, you can:
- Use
sar -u,sar -randsar -dto see what CPU, memory and disk looked like around that time. - Check your WordPress logs or host panel for traffic and error spikes at the same time.
This helps you distinguish between genuine resource exhaustion and application‑level issues.
Using sar to support capacity planning
Deciding whether you really need more CPU, RAM or faster storage
Over weeks or months, sar gives you enough data to spot trends:
- CPU consistently high during business hours: more cores or performance tuning may be needed.
- Memory regularly dipping into swap: more RAM or optimisation.
- Disk I/O frequently near saturation: faster storage (for example moving to SSD/NVMe) or reducing disk‑heavy tasks.
Used alongside a capacity planning guide such as Practical Capacity Planning for VPS and VDS, this makes upgrade decisions much more grounded.
Putting It Together: A Simple Checklist When Your Site Feels Slow
Step‑by‑step live triage using top, htop, iotop and ss
Is it CPU, memory, disk or network?
When the site feels slow right now, you can follow this basic flow:
- Check CPU and load
Runtoporhtop.- If load > cores for a sustained period and CPU bars are mostly full, CPU is likely the bottleneck.
- Note which processes are at the top by CPU.
- Check memory and swap
Still intop/htop, look at memory and swap.- If swap is high and growing, RAM is tight.
- Check disk I/O
Runsudo iotop.- If one process is doing heavy reads/writes, note its name.
- Check network connections
Run:sudo ss -tn state established '( sport = :80 or sport = :443 )'- See if many connections come from a single IP.
Write down times, key numbers and process names. This record is invaluable when speaking to support, your developer or your hosting provider.
Quick notes you can capture for your host or developer
Useful information to copy/paste into a ticket or email includes:
- Output of
top -b -n 1 | head -n 20(summary plus top processes). - A short
iotop -b -n 5snapshot. - Any
ssconnection stats that show unusual patterns. - Relevant
sarlines around the time of the incident.
This concrete data helps others diagnose quickly and avoids guesswork.
Using sar and your host’s graphs to spot patterns
Outside of incidents, compare sar history with any graphs in your hosting control panel. Our guide How to Read a WordPress Hosting Resource Graph explains how these graphs map to CPU, RAM and I/O and what different patterns mean.
Look for recurring high‑load periods and match them to:
- Marketing campaigns or peak shopping times.
- Scheduled backups or scans.
- Batch jobs like imports or report generation.
Common false alarms: when high numbers are actually fine
Some “scary” numbers are often harmless:
- Low “free” RAM but plenty of “available” memory, with low swap.
- Short CPU spikes during brief bursts of traffic that quickly settle.
- Occasional high disk I/O during a backup window you are aware of.
The goal is not a perfectly flat graph, but a system that copes with expected peaks without prolonged overload.
When Monitoring Turns Into Operations Work (And Managed Hosting Makes Sense)
Tasks that are reasonable to handle yourself on a single VPS or VDS
For one or two business sites, it is quite realistic to handle:
- Basic monitoring using the tools in this guide.
- Applying OS and software updates regularly.
- Adjusting simple limits and timeouts with guidance.
It is wise to test significant configuration changes on a staging system if possible, and to keep a simple log of everything you change. Our First 48 Hours on a New Linux VPS article can help you establish good habits early.
Signs you need managed monitoring and tuning
Over time, manual monitoring can grow into ongoing operations work. You might consider a managed solution or a managed virtual dedicated server when you see:
Constant high load or recurring incidents
- Frequent slowdowns that require you to log in and check
toporiotop. - Regular need to tune MySQL, PHP‑FPM, web servers and caching layers.
- A desire for automated alerts based on thresholds rather than manual checks. Our guide Server Monitoring for Non‑Admins covers simple alerting as a next step.
Compliance, card payments and uptime guarantees
- Taking card payments directly and needing to demonstrate regular patching and monitoring.
- Needing documented uptime targets and response times.
- Wanting someone to own tuning, security hardening and capacity planning so you can focus on the application or business.
For many single‑site owners who just want a fast, reliable WordPress or WooCommerce shop without day‑to‑day server work, a specialised platform such as G7Cloud’s Managed WordPress hosting can be more comfortable than running a full VPS or VDS.
Next steps: where to learn more about Linux basics and monitoring
If you would like to deepen your skills from here, useful next areas are:
- Learning more about SSH workflow and safe editing of configuration files.
- Exploring basic firewall rules and network hardening.
- Setting up lightweight monitoring and alerting that complements these manual tools.
As your sites and traffic grow, you may also want to look at performance layers in front of the server. The G7 Acceleration Network, for example, can automatically optimise images into AVIF and WebP on the fly and includes bot protection that filters abusive traffic before it reaches PHP or the database, helping keep the numbers you see in top and htop more stable.
If you are starting to outgrow a basic VPS or feel you are spending too much time firefighting performance, it may be worth exploring whether an unmanaged or managed virtual dedicated server, or managed WordPress hosting, is the right next step for your situation.