
System logs are often the first place to look when something is not quite right on a Linux server. Whether you run a small WordPress site or several busy applications, learning where logs live and how to read them will save a lot of time and guesswork.
This guide focuses on practical use of logs: where to find them, how to read them safely, how they relate to performance and security, and when it might make sense to hand some of this work to a managed service.
If you are not yet comfortable connecting to your server, you may want to read How to Connect to a Linux Server Securely Using SSH first. All the examples below assume you are connected to a shell on the server.
Why System Logs Matter on a Linux Server
What a log actually is in plain language
In simple terms, a log is just a diary your server keeps about what it is doing.
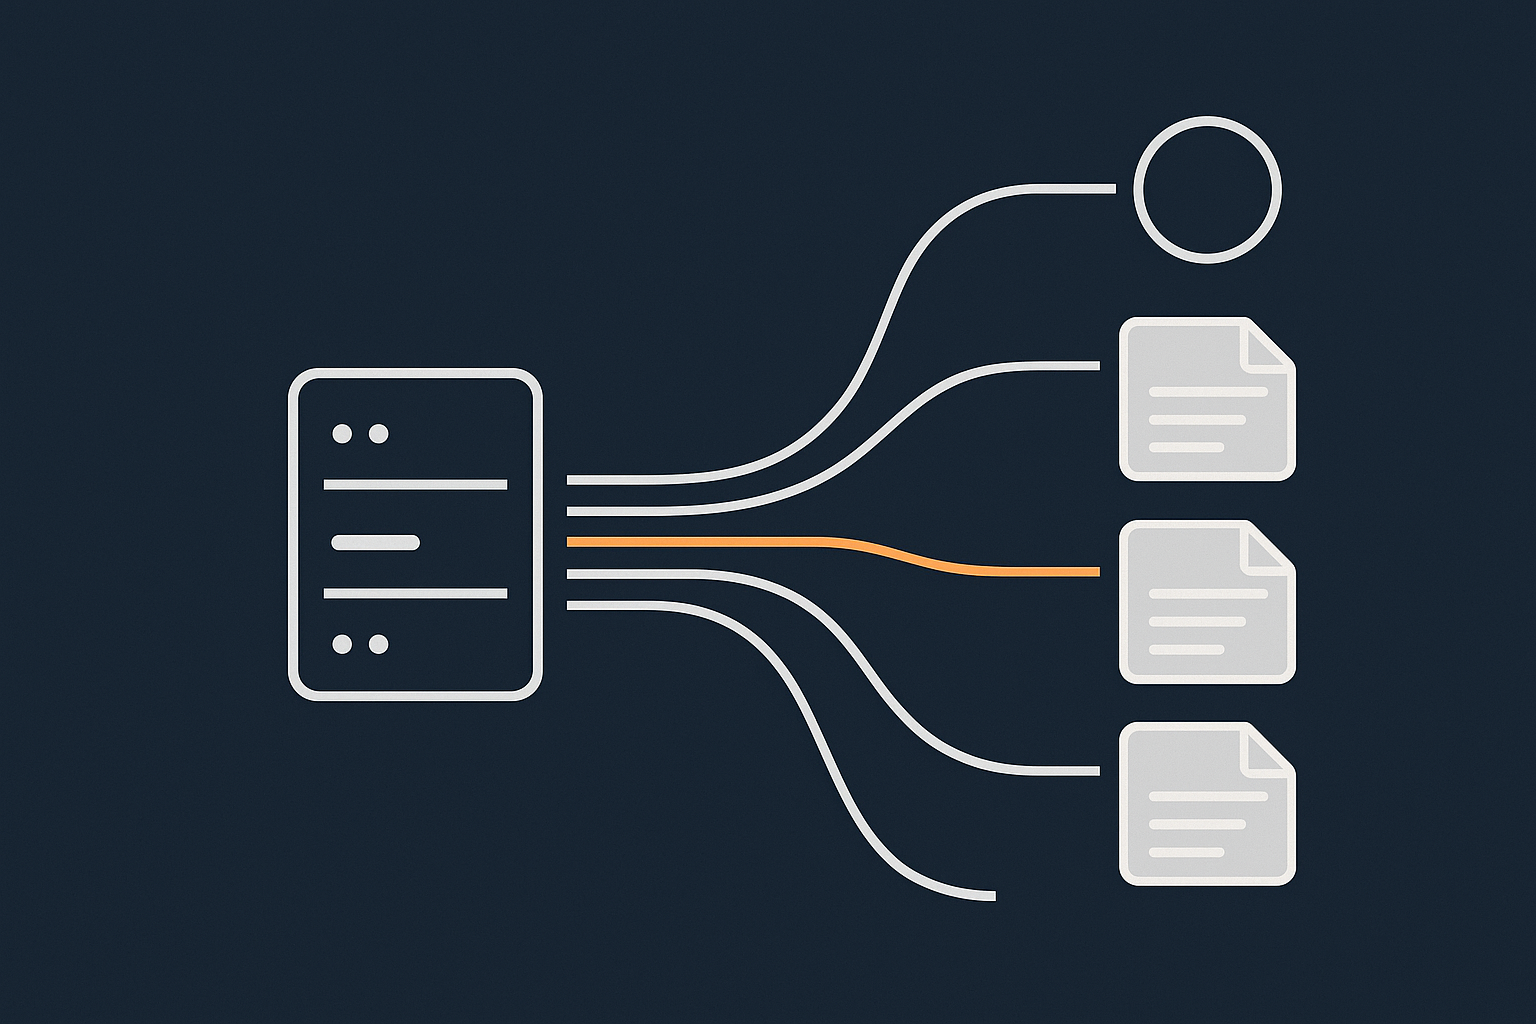
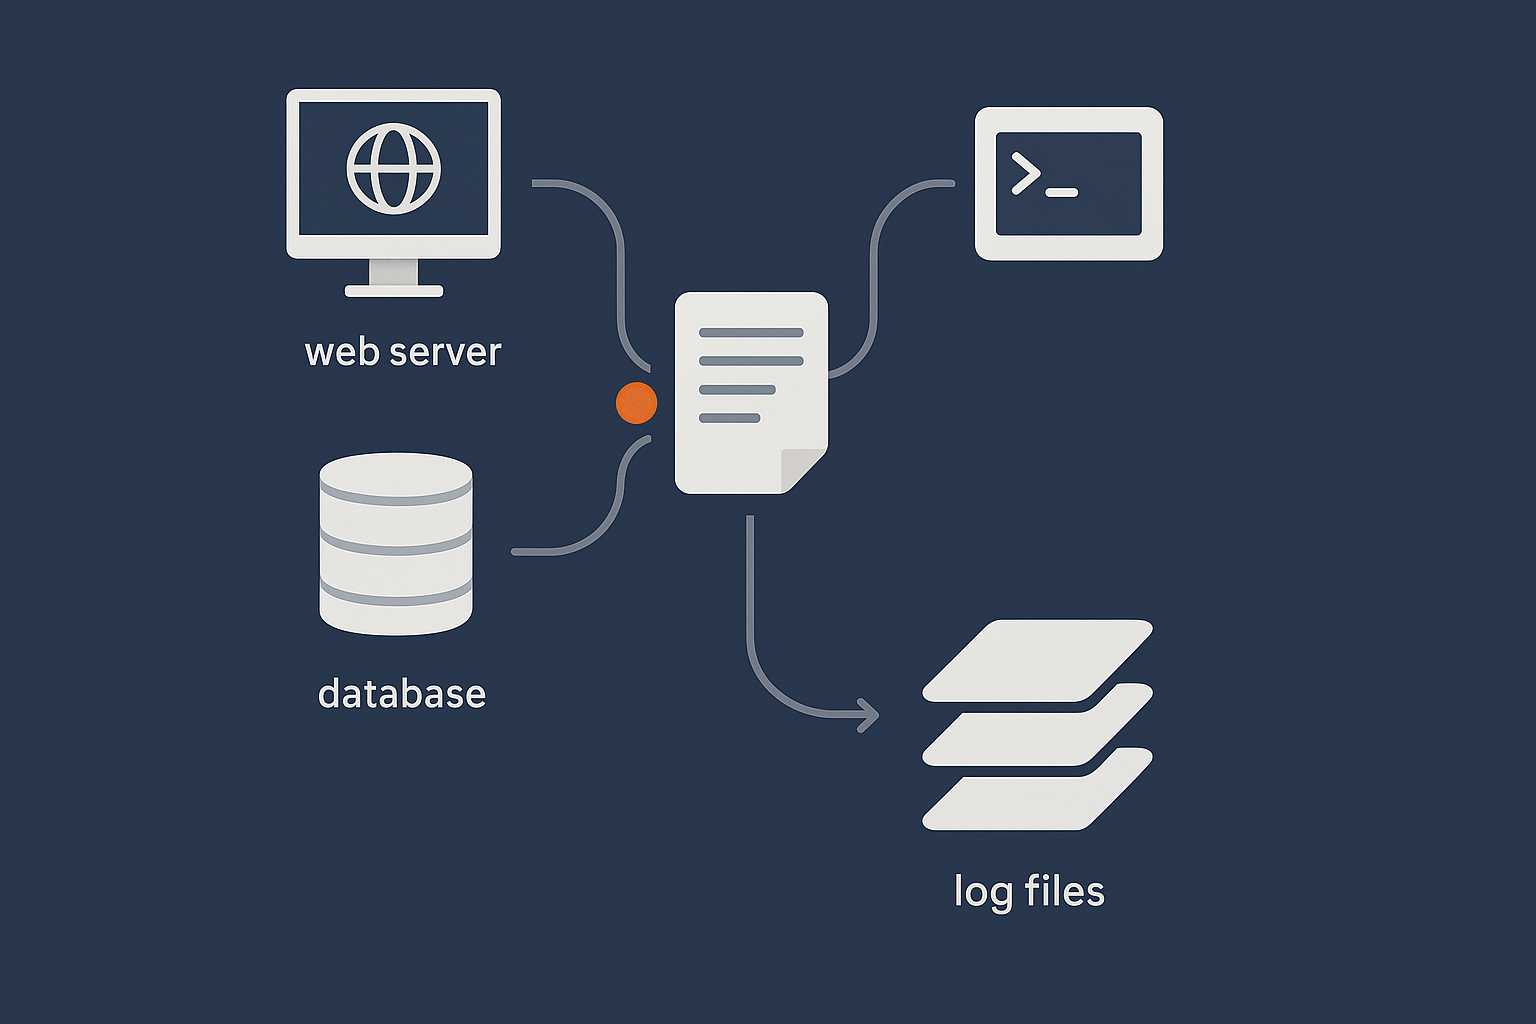
Programs on your server, such as the web server, database, SSH daemon or kernel, regularly write short messages describing events. For example:
- A user successfully logging in or failing to log in
- A web request that resulted in an error
- A service starting, stopping or restarting
- A hardware event, such as a disk or network issue
These messages are written to log files or to a central logging system. You can then read those logs later to understand what happened and when.
Typical problems that logs can help you diagnose
System logs are helpful for diagnosing many everyday issues, for example:
- Websites returning 500 errors or timing out
- WordPress plugins causing PHP errors
- MySQL or MariaDB refusing connections
- SSH logins failing unexpectedly
- High CPU or memory usage
- Repeated login attempts from unknown IP addresses
- Crons not running when expected
Instead of guessing, you can usually find a clear message in one or more log files that points you in the right direction.
How logging fits into uptime, performance and security
On an unmanaged VPS or virtual dedicated server, you are responsible for the health of the system. Logs support that responsibility in three main ways:
- Uptime: If a site goes down, logs can reveal whether the cause is a service crash, configuration error, resource exhaustion or something external. This pairs well with the concepts in Why Websites Go Down: The Most Common Hosting Failure Points.
- Performance: Slow queries, PHP warnings or resource limits often show up in logs long before a site becomes unusable.
- Security: Authentication logs and firewall logs help you see who is trying to access your server and whether they are legitimate.
On managed and unmanaged virtual dedicated servers, you still benefit from understanding logs, but on a managed plan much of the monitoring and response to log signals can be handled for you.
How Linux Logging Works at a High Level
The classic text log files in /var/log
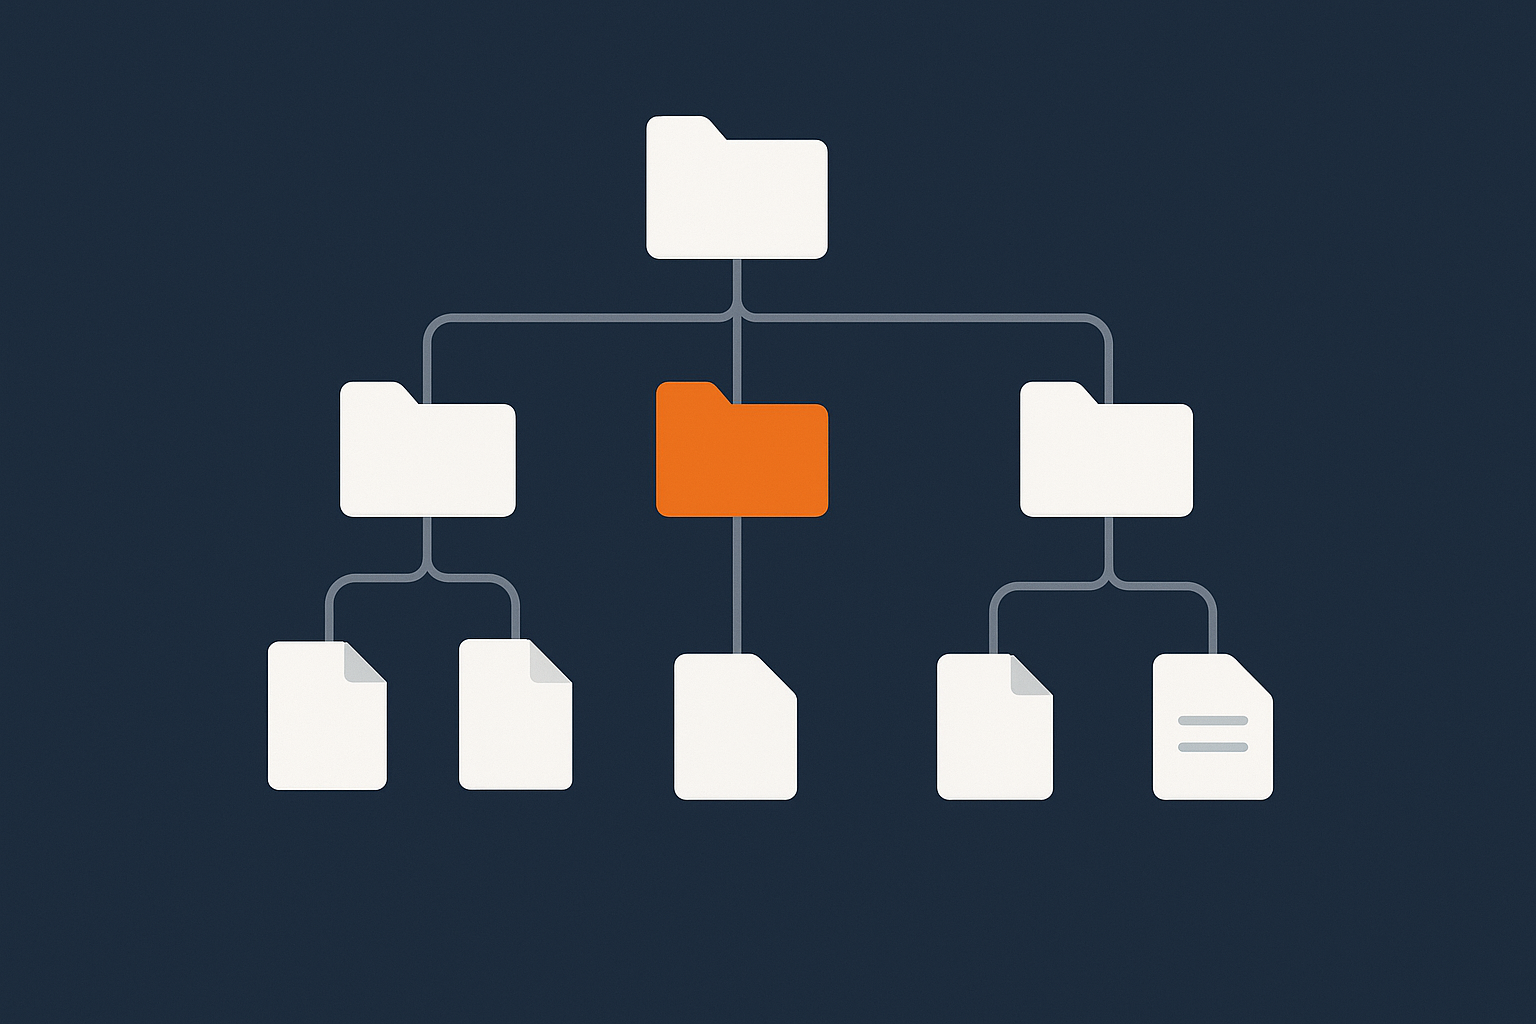
Traditionally, most logs on Linux are written as plain text files under the /var/log directory. Each service tends to have its own file or set of files, for example:
/var/log/syslogor/var/log/messagesfor general system events/var/log/auth.logor/var/log/securefor authentication/var/log/nginx/access.loganderror.logfor Nginx/var/log/apache2/or/var/log/httpd/for Apache
Because these are plain text files, you read them with standard tools such as less, tail and grep.
rsyslog, systemd-journald and the logging pipeline
Modern Linux distributions use a logging pipeline. At a high level:
- Applications send log messages to the system logger.
- The system logger decides what to do with those messages.
- Messages may be written to the systemd journal, to text files under
/var/log, or even forwarded to a remote logging server.
Two key components here are:
- rsyslog (or older syslog variants) which traditionally receives messages and writes them to files like
/var/log/syslogor/var/log/messages. - systemd-journald which is part of systemd and keeps a binary log called the journal. You read it using
journalctl.
On many servers, both are used together. Services log to systemd, which stores messages in the journal, and rsyslog then reads from the journal and writes the most important messages into text files under /var/log.
Distribution differences: Ubuntu / Debian vs CentOS / Rocky / Alma
The main families you will see are:
- Debian / Ubuntu:
- General system logs:
/var/log/syslog - Authentication logs:
/var/log/auth.log - Uses systemd-journald plus rsyslog by default on most versions
- General system logs:
- CentOS / Rocky / AlmaLinux:
- General system logs:
/var/log/messages - Authentication logs:
/var/log/secure - Also uses systemd-journald with rsyslog on typical builds
- General system logs:
The principles are the same, but file names and locations differ slightly. When in doubt, journalctl is usually available on any modern systemd based distribution.
The /var/log Directory Explained
Taking a safe look at /var/log
Before you change anything, it is useful to explore /var/log to see what is there. These commands are read only and safe.
Commands: ls, du, less, tail
List the contents of /var/log
cd /var/log
ls
This changes directory to /var/log and lists the files and directories. You will see files such as syslog, auth.log, messages or secure, along with subdirectories like nginx, apache2 or httpd.
Check how much space logs are using
sudo du -sh /var/log/*
This shows the disk usage of each file and directory under /var/log in a human readable format. Use sudo because some logs are only readable by root. This helps identify unusually large log files but does not modify anything.
View a log file page by page
sudo less /var/log/syslog
Replace syslog with messages on CentOS style systems:
sudo less /var/log/messages
less lets you scroll with the arrow keys or PageUp/PageDown. Press q to quit. Nothing is changed by viewing logs.
View the end of a log file
sudo tail -n 50 /var/log/syslog
This prints the last 50 lines of /var/log/syslog. Adjust the number as needed. This is useful directly after reproducing an issue, such as a failed login or a PHP error.
Safety note: do not randomly delete log files to free space
When disk space is tight it can be tempting to delete big log files. This is risky for two reasons:
- Active logs are usually being written to by services. Deleting them while open can confuse applications and logging services.
- You may remove information that is useful for diagnosing the root cause of the disk usage problem.
If you must reclaim space urgently, it is safer to truncate a log file instead of deleting it, but only after you have taken any necessary backups and confirmed you no longer need the contents:
sudo truncate -s 0 /var/log/large-log-file.log
This keeps the file but empties it. Use this with care and only when you understand which service owns the log file. We will look at safer long term solutions with logrotate later.
Common log files and what they are for
/var/log/messages and /var/log/syslog
These files contain general system messages.
- On Debian / Ubuntu:
/var/log/syslog - On CentOS / Rocky / AlmaLinux:
/var/log/messages
You will see entries from many services here: networking, cron, system services, and sometimes application messages.
To view the latest entries:
sudo tail -n 100 /var/log/syslog      # Debian / Ubuntu
sudo tail -n 100 /var/log/messages    # CentOS / Rocky / Alma
Use this when you are not sure where to start. It often contains hints related to crashes, restarts and general issues.
/var/log/auth.log and secure authentication logs
Authentication logs track logins and related security events:
- On Debian / Ubuntu:
/var/log/auth.log - On CentOS / Rocky / AlmaLinux:
/var/log/secure
They record SSH logins, sudo usage, and sometimes FTP or other authentication events.
sudo tail -n 50 /var/log/auth.log     # Debian / Ubuntu
sudo tail -n 50 /var/log/secure       # CentOS / Rocky / Alma
Use these files when investigating unexpected logins, repeated password failures or locked accounts. If you see many repeated failed SSH logins from the same IP, it may indicate automated scans or brute force attempts.
/var/log/kern.log and kernel messages
/var/log/kern.log (Debian / Ubuntu) contains messages from the Linux kernel. On CentOS style systems, kernel messages are typically mixed into /var/log/messages.
These logs are useful when you suspect hardware or low level issues, such as disk errors, network interface problems or kernel driver messages.
sudo tail -n 50 /var/log/kern.log # Debian / Ubuntu
dmesg and boot messages
dmesg prints kernel messages, including those from early boot. It does not read from a file but from a kernel buffer.
dmesg | less
This lets you scroll through the output. Look here when you need details about boot issues, device detection or driver problems. On some systems, the contents of dmesg are also written into log files such as /var/log/dmesg or /var/log/kern.log.
Using journalctl with systemd-based Servers
What the systemd journal is
The systemd journal is a structured log store maintained by systemd-journald. Unlike plain text files, it stores metadata such as the service name, PID and priority for each message. You query it with journalctl.
The journal is often the most complete source of log information because services managed by systemd log there by default. rsyslog then selects which entries to copy into text files under /var/log.
Basic journalctl commands you will actually use
View recent logs
To see the most recent messages:
sudo journalctl -n 100
This prints the last 100 lines from the journal. You can adjust the number. It is similar to tail for the unified log stream.
To follow new messages in real time:
sudo journalctl -f
This is like tail -f for the journal. It is particularly useful when you reproduce a problem and want to watch what the system logs as it happens.
Filter by time
You can limit logs to a specific time range:
sudo journalctl --since "2025-01-01 10:00" --until "2025-01-01 11:00"
Or use relative times:
sudo journalctl --since "1 hour ago"
This is helpful when correlating logs with an incident reported by a monitoring tool or a user.
Filter by service (for example, nginx, php-fpm, sshd)
Most systemd services have a unit name like nginx.service or php8.2-fpm.service. To filter by unit:
sudo journalctl -u nginx.service -n 50
This shows the last 50 log messages from the Nginx service. Some common examples:
sudo journalctl -u ssh.service -n 50       # SSH on some distros
sudo journalctl -u sshd.service -n 50      # SSH on others
sudo journalctl -u php-fpm.service -n 50   # Generic name on some systems
Use systemctl list-units --type=service to see the exact unit names on your system.
Comparing journalctl output to classic log files
In many situations you can choose between reading /var/log/* files or using journalctl. Some practical guidelines:
- If you know the service name,
journalctl -uis often faster than searching several text files. - If you are following long term logs or using external tools to analyse text, classic log files may be more convenient.
- On very recent incidents, the journal may show messages that have not yet been written to rotated text files.
It is worth being comfortable with both, as you will encounter both styles when working across different distributions and hosting environments.
Where to Find Web Server Logs (Apache and Nginx)
Why web server logs are critical for WordPress and WooCommerce troubleshooting
For WordPress or WooCommerce sites, web server logs are often the most useful logs day to day. They capture:
- Each HTTP request and its status code (access logs)
- Errors that occurred while serving requests (error logs)
When a page returns a 500 error, times out, or behaves inconsistently, the web server error log usually contains the first clear clue. For heavy WooCommerce sites, access logs can also reveal spikes in traffic, bots repeatedly loading expensive endpoints, or checkout issues.
Later, we will see how this fits with PHP and database logs.
Default locations for Apache logs
Debian / Ubuntu style paths
On Debian and Ubuntu, Apache logs are usually under /var/log/apache2:
/var/log/apache2/access.log/var/log/apache2/error.log
To see recent errors:
sudo tail -n 50 /var/log/apache2/error.log
If you are using virtual hosts, you may also have per site logs such as example.com-error.log in the same directory, depending on your Apache configuration.
CentOS / Rocky / Alma style paths
On CentOS, Rocky and AlmaLinux, Apache is usually called httpd and logs live under /var/log/httpd:
/var/log/httpd/access_log/var/log/httpd/error_log
To view the end of the error log:
sudo tail -n 50 /var/log/httpd/error_log
Access logs vs error logs
It is important to distinguish the two:
- Access logs record each request: IP, URL, HTTP status, response size, user agent. Use these to understand traffic patterns, repeated 404s, or bot activity.
- Error logs record problems: configuration errors, permission issues, upstream timeouts, PHP fatal errors (depending on configuration) and module failures.
If a user reports an error, you will normally check the error log first, then confirm the corresponding request in the access log if needed.
Default locations for Nginx logs
Nginx usually logs to /var/log/nginx on both Debian/Ubuntu and CentOS style systems:
/var/log/nginx/access.log/var/log/nginx/error.log
Some control panels or multi site configurations may have per site log files here too.
sudo tail -n 50 /var/log/nginx/error.log
Use the error log for 500s, 502s and timeouts, and the access log when you want to understand who is requesting what, and how often.
Reading logs in real time with tail -f
To watch logs as new entries are written, use tail -f. This is useful when you can reproduce a problem in your browser and watch the log update at the same time.
sudo tail -f /var/log/nginx/error.log
Now reload your problem page in the browser. You should see new lines appear in the log that correspond to the request.
Press Ctrl + C to stop following the log.
Common patterns: 500 errors, 404 floods, bad bots
- 500 errors: In the error log you may see PHP fatal errors, upstream timeouts from PHP FPM, or permission errors. These usually pair with a 500 status in the access log.
- 404 floods: Access logs showing many 404s to random paths, especially
/wp-login.phpor obvious attack patterns, often indicate bot scans. These increase CPU and PHP load if uncached. - Bad bots: Repeated requests from a small set of IPs, often with unusual user agents, can quickly inflate logs and waste resources.
Using a filtered network layer or WAF, such as the web hosting security features such as firewalls and malware protection available on G7Cloud, can block much of this unwanted traffic before it ever reaches your web server and logs.
The G7 Acceleration Network also filters abusive or non human traffic and can significantly reduce log noise and wasted PHP or database work.
Where to Find PHP, Database and Application Logs
PHP error logs for WordPress sites
PHP errors are often the root cause of 500 responses on WordPress sites, especially after installing or updating plugins and themes.
Typical file locations (per distribution and panel)
PHP logs can live in different places depending on how PHP is installed and which control panel you use. Common locations include:
/var/log/php8.2-fpm.logor similar for PHP FPM/var/log/php7.4-fpm.logon older systems/var/log/php_errors.log- Per domain logs under a panel directory, such as:
/var/www/vhosts/example.com/logs/php_error.log(Plesk style)/home/username/logs/(cPanel style)
You can search for PHP related logs with:
sudo find /var/log -type f -iname "*php*log"
This does not change anything, it simply lists files that look like PHP logs. Once you identify the right file, use tail or less to inspect it.
Enabling WP_DEBUG_LOG safely on a staging or development copy
WordPress can write its own debug log through WP_DEBUG_LOG, but it is better to enable this on a staging or development copy rather than directly on a busy production site.
On a staging site, edit wp-config.php (take a backup first):
define( 'WP_DEBUG', true );
define( 'WP_DEBUG_LOG', true );
define( 'WP_DEBUG_DISPLAY', false );
This will create a wp-content/debug.log file where WordPress logs PHP notices and errors. Set WP_DEBUG_DISPLAY to false to avoid showing errors to visitors.
Undoing this change: Once you have captured the information you need, set WP_DEBUG back to false or comment out these lines to disable debug logging, especially on production. Always keep a note of the changes you make for later reference.
MySQL / MariaDB logs
General log, slow query log and error log
MySQL and MariaDB have several types of logs:
- Error log: Service startup, shutdown, crashes, serious errors. This is the first place to look when the database will not start.
- Slow query log: Queries that take longer than a configured threshold. Useful for performance tuning.
- General query log: Every query. This is rarely enabled on production because it is verbose and can impact performance.
Where these usually live and how to check if they are enabled
Common locations include:
/var/log/mysql/error.log(Debian / Ubuntu)/var/log/mysqld.logor/var/log/mariadb/mariadb.log(CentOS style)- Logs defined in your
my.cnformariadb.conf.dconfiguration
To check configuration, look for log related lines:
sudo grep -i "log" /etc/mysql/my.cnf /etc/mysql/conf.d/*.cnf 2>/dev/null
sudo grep -i "log" /etc/my.cnf /etc/my.cnf.d/*.cnf 2>/dev/null
This searches MySQL / MariaDB configuration files for options that mention “log”. It does not change anything.
Enabling the slow query log or changing log file paths should be done carefully and preferably on a non production instance first, as it can affect performance and disk usage.
Other services: mail, cron and firewall logs
Some other useful logs:
- Cron:
- Debian / Ubuntu:
/var/log/cron.logor within/var/log/syslog - CentOS style:
/var/log/cron
- Debian / Ubuntu:
- Mail:
/var/log/mail.log,/var/log/maillogor service specific logs such as/var/log/exim4/,/var/log/postfix/
- Firewall:
- Often within
/var/log/kern.log,/var/log/messagesor custom files, depending on whether you use iptables, nftables or a front end like firewalld or ufw.
- Often within
Use these when scheduled jobs are not firing, emails fail to deliver, or you suspect traffic is being blocked or dropped.
Practical Examples: Using Logs to Solve Real Problems
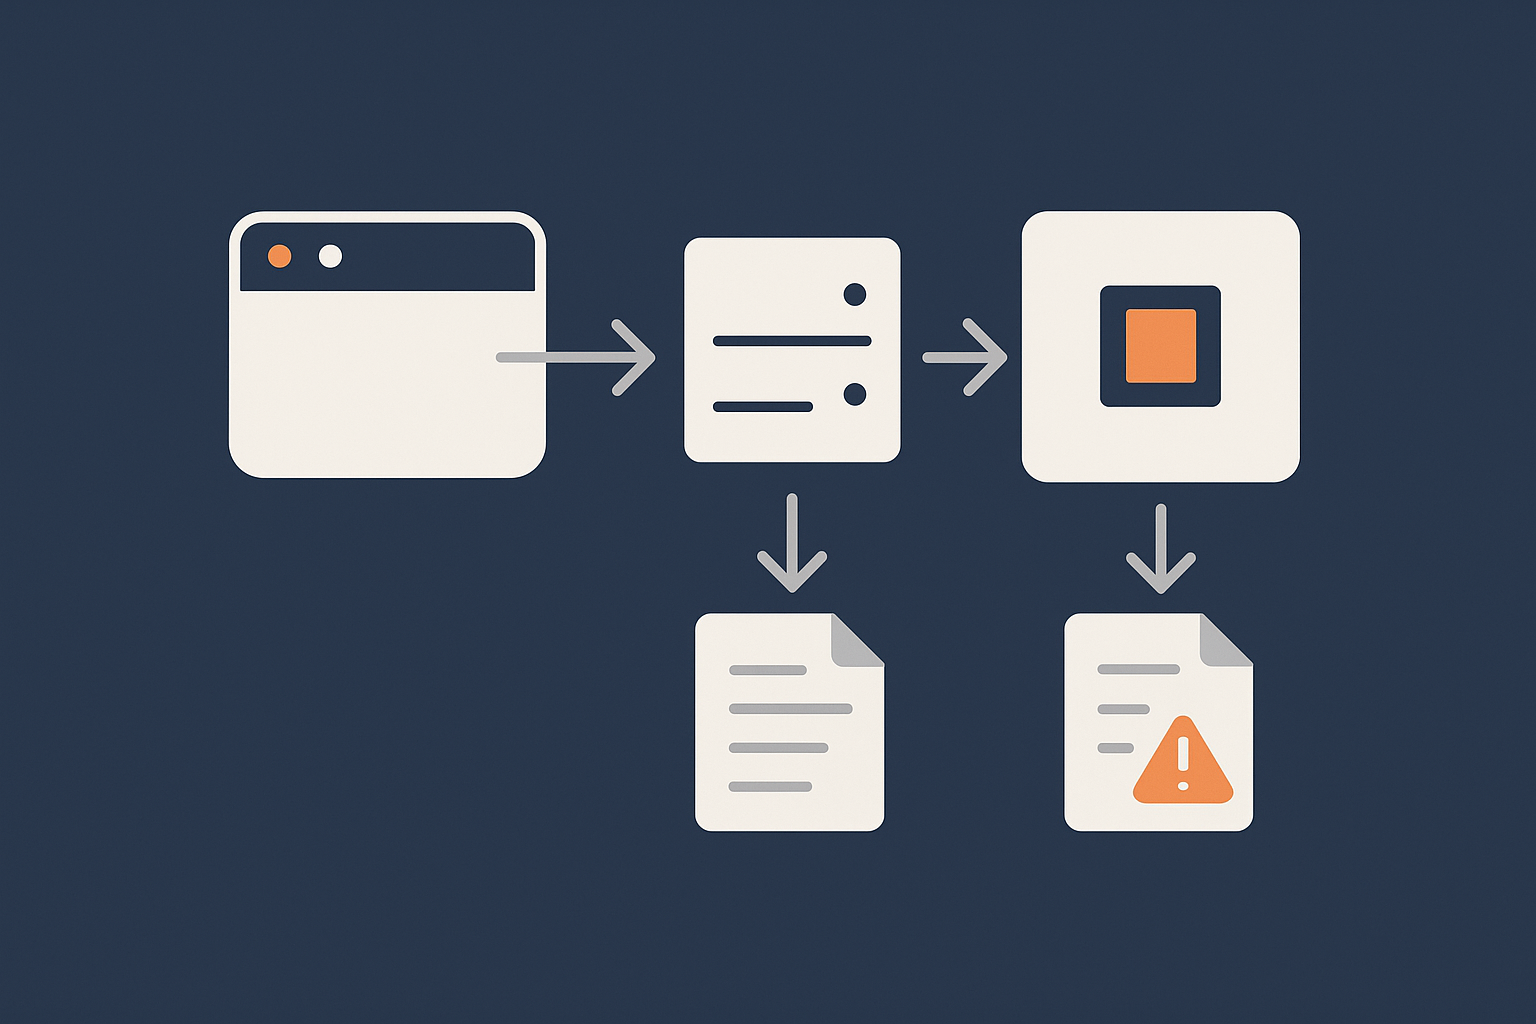
Investigating a 500 error on a WordPress page
Step 1: Confirm the error in the browser / monitoring tool
First, reproduce the error:
- Load the problematic page in your browser.
- Note the time and any specific error message.
- If you use monitoring tools, confirm when the 500 errors started.
This timing information will help you target the relevant log entries.
Step 2: Check the web server error log
On Nginx:
sudo tail -n 50 /var/log/nginx/error.log
On Apache (Debian / Ubuntu):
sudo tail -n 50 /var/log/apache2/error.log
On Apache (CentOS style):
sudo tail -n 50 /var/log/httpd/error_log
Reload the page and watch the log with tail -f if needed. Look for lines mentioning:
- “PHP Fatal error” or “Uncaught exception”
- “upstream timed out” or “upstream sent too big header” (Nginx)
- Permissions or “Permission denied” errors
Step 3: Check PHP error logs and the system journal
If the web server points to PHP issues, check your PHP logs:
sudo tail -n 50 /var/log/php8.2-fpm.log # Adjust version / path
Or, on a systemd based PHP FPM service, use:
sudo journalctl -u php8.2-fpm.service -n 50
Look for clear fatal error messages, such as a missing include file, syntax error, or fatal error in a particular plugin.
Once you identify a failing plugin or theme, you can safely disable it via the WordPress admin (if accessible) or by renaming its directory via SSH or SFTP. Remember to keep a record of the changes made, and consider replicating them on a staging site first for more complex issues.
Tracking down high CPU or memory usage
Cross checking resource usage tools with logs
If you notice high CPU, memory or disk usage (for example using the tools described in How to Check CPU, Memory and Disk Usage on a Linux Server), logs can help you understand why.
A simple approach:
- Note the processes using the most CPU or memory (for example,
php-fpm,mysqld,nginx). - Check the relevant logs for the same time window:
- PHP logs for heavy or failing scripts
- MySQL slow query log for slow database queries
- Web server access logs for traffic spikes or bots
- Use
journalctl --since "15 minutes ago"to spot correlated warnings, crashes or resource related messages.
For example, if high CPU usage coincides with many repeated requests in the access log from a few IPs, you may choose to block or rate limit those IPs, or add caching. The G7 Acceleration Network can also help here by filtering abusive traffic and caching content close to visitors, which reduces the volume of dynamic PHP and database work.
Spotting repeated login attempts or suspicious activity
auth.log / secure and SSH brute force attempts
Authentication logs often show patterns of repeated failed SSH logins, usually with random usernames. To check:
sudo tail -n 100 /var/log/auth.log    # Debian / Ubuntu
sudo tail -n 100 /var/log/secure      # CentOS / Rocky / Alma
Look for lines with “Failed password” or “Invalid user”. To quickly summarise:
sudo grep "Failed password" /var/log/auth.log | tail -n 50
If you see many attempts from the same IP addresses, you may want to tune your firewall or fail2ban rules, or move SSH to key based authentication only.
Why a WAF or filtered network layer helps before it hits your server
Although rate limiting and fail2ban help, preventing hostile traffic from reaching your server at all is even more effective. A web application firewall (WAF) or filtered network layer can:
- Block known bad IP ranges and attack patterns
- Challenge suspicious traffic before it reaches your server
- Reduce the number of login attempts and exploit scans recorded in your logs
On G7Cloud, features such as the G7 Acceleration Network provide this filtered edge layer, which lowers background noise and helps keep system logs focused on genuinely useful information.
Managing Log Size Safely
Why logs grow and how that can fill your disk
Logs naturally grow over time as services keep writing entries. High traffic sites, verbose logging settings or misconfigured services can cause logs to grow very quickly.
If logs are not rotated and compressed regularly, they can fill your disk. A full root filesystem can cause services to fail, databases to stop writing data, and even prevent SSH logins in some circumstances.
It is therefore important to have log rotation configured and to check occasionally that it is working as expected.
Log rotation with logrotate
How rotation, compression and retention work in plain language
logrotate is a common tool that automatically:
- Renames the current log file and starts a fresh one.
- Compresses old logs to save space.
- Deletes logs older than a set retention period.
For example, /var/log/nginx/access.log might be rotated daily into files like:
access.log.1access.log.2.gzaccess.log.3.gz
Where older ones are compressed (.gz) and eventually removed.
Checking existing logrotate rules without breaking anything
Logrotate configuration is usually in:
/etc/logrotate.conffor global settings/etc/logrotate.d/for per service rules
To list existing rules:
ls /etc/logrotate.d/
To safely inspect, for example, the Nginx rule:
sudo less /etc/logrotate.d/nginx
Here you can see how often logs are rotated (daily, weekly), how many are kept (rotate 14) and whether they are compressed (compress).
You can also run logrotate in debug mode to see what it would do, without applying changes:
sudo logrotate -d /etc/logrotate.conf
This prints actions but does not rotate any files. It is a safe way to check configuration.
If you need to adjust retention or frequency, make small changes, keep a note of what you changed, and ideally test first on a non production server.
What not to do when logs are filling disk space
Dangerous patterns: deleting active log files, chmod 777 to silence errors
Two patterns to avoid:
- Deleting active log files: Removing files that services are actively writing to can lead to confusion, unexpected behaviour and loss of diagnostic data. Truncating the file or adjusting logrotate is safer.
- Using
chmod 777to silence errors: If logs or applications complain about permissions, simply making files or directories world writable typically introduces security risks without solving the real problem. Instead, understand which user or group should own the files and set appropriate permissions. The article Understanding Linux Users, Groups and File Permissions on Your Server provides a clear explanation of how to do this safely.
If you consistently struggle with log growth or file permissions on an unmanaged server, it may be a sign that you would benefit from a more guided or managed environment, especially for critical business sites.
When Logs Are a Signal to Consider Managed Hosting
Recognising when issues are beyond casual troubleshooting
Reading logs to solve occasional problems is realistic for many technically minded site owners. However, if you find that:
- Security alerts and suspicious log entries are frequent and complex
- Performance issues require deep database or PHP tuning
- Crashes or kernel level errors become a recurring theme
then you are starting to move from casual troubleshooting into ongoing system administration.
How managed virtual dedicated servers can take over log monitoring and response
On managed and unmanaged virtual dedicated servers, you choose how much of this responsibility you want to keep.
- On an unmanaged server, you handle patches, log monitoring, incident response, and security decisions yourself.
- On a managed server, a dedicated team can:
- Monitor key logs and alerts
- Investigate recurring errors
- Apply configuration changes and patches safely
- Advise on capacity planning and scaling
This does not remove the value of understanding logs, but it reduces the operational burden and risk, particularly for organisations where the priority is the application or business, not the server itself.
Where logging fits into your wider monitoring and maintenance routine
Healthy server management usually includes:
- Regular updates and patching, carried out carefully as described in How to Safely Update and Patch a Linux Server (Without Breaking Your Sites)
- Resource monitoring for CPU, memory, disk and bandwidth
- Uptime checks for key websites and services
- Log monitoring or at least periodic review of key logs
- Backups or snapshots before major changes
Logs provide context and detail across all of these areas. They turn a high CPU alert or uptime warning into a concrete story of what happened and how to fix it.
If your main goal is simply to run one or two stable WordPress or WooCommerce sites without managing this routine yourself, it may be worth looking at G7Cloud’s Managed WordPress hosting and specialist WooCommerce hosting, where much of this operational work is handled for you.
Summary: Building a Healthy Habit Around Logs
Key log locations to remember
As a quick reference:
- General system:
/var/log/syslog(Debian / Ubuntu)/var/log/messages(CentOS / Rocky / Alma)
- Authentication:
/var/log/auth.log(Debian / Ubuntu)/var/log/secure(CentOS style)
- Web servers:
- Apache:
/var/log/apache2/or/var/log/httpd/ - Nginx:
/var/log/nginx/
- Apache:
- PHP:
/var/log/php*-fpm.log, panel specific logs, orwp-content/debug.logon WordPress withWP_DEBUG_LOGenabled
- Database:
/var/log/mysql/,/var/log/mysqld.log,/var/log/mariadb/
- Systemd journal:
journalctl, with filters such as-u,-nand--since
A simple weekly or monthly log check routine
To build a steady habit, you might:
- Once a week:
- Scan
/var/log/syslogor/var/log/messagesfor new warnings or errors. - Check web server error logs for recent entries.
- Briefly review authentication logs for unusual patterns.
- Scan
- Once a month:
- Verify logrotate is working and that old logs are being compressed and removed.
- Confirm disk usage under
/var/logis stable. - Review database and PHP logs for recurring notices or slow queries.
Keep a simple change log of any configuration updates you make, along with the date and reason. This makes future troubleshooting much easier.
Next steps and further reading
If you would like to deepen your understanding, the following official documentation is useful:
From here, a natural next step is to combine what you have learned about logs with good monitoring, patching and backup habits. If you reach a point where log analysis and server maintenance are taking more time than you would like, you might find it helpful to explore G7Cloud’s managed and unmanaged virtual dedicated servers or our Managed WordPress hosting options, so you can choose the balance of control and convenience that best fits your projects.