Who This Guide Is For (And Why Postmortems Matter More Than You Think)
This guide is for people who are responsible for a website or online service, but are not full time infrastructure engineers. You might run a WordPress or WooCommerce site, manage a digital team, or own the relationship with your hosting provider.
You probably care about questions like:
- Why did our site go down?
- Could we have spotted this earlier?
- What needs to change so this does not happen again?
Postmortems are simply a structured way to answer those questions after an incident, calmly and with evidence. They turn a bad day into useful information for your next decision about uptime, architecture and risk.
Typical situations where postmortems get skipped or become shouting matches
In practice, many organisations either skip postmortems or treat them as a ritual where nothing really changes. Common patterns include:
- “Firefighting fatigue”: once the incident is over, everyone is exhausted and moves straight on to the next task.
- Blame and defensiveness: internal teams and the host argue about who is at fault, instead of looking at the system as a whole.
- Only looking at the last failure: each outage is treated as a one off, without spotting repeating patterns.
- No clear owner: nobody is responsible for running the review or following up on actions.
- Too technical or too shallow: the conversation either drowns in low level detail, or stays at vague labels like “a glitch”.
The result is that incidents keep hurting uptime, revenue and reputation, with little learning in return.
What a good hosting postmortem actually delivers for your business
A well run hosting postmortem is a decision tool, not a blame session. It should give you:
- A clear narrative: what happened, when, and how users were affected.
- Evidence based causes: not just “the server was busy”, but which constraints and decisions led to the issue.
- Concrete improvements: specific changes to configuration, monitoring, architecture or processes.
- More realistic expectations: a better sense of what your current setup can handle, and where its limits are.
- Inputs into risk and governance: information you can feed into your risk register, SLAs and disaster recovery plans.
Handled this way, even painful incidents improve your next budgeting, scaling and hosting choices.
Postmortems in Plain English: What They Are (And Are Not)
The difference between a postmortem, an RFO and a status update
Terminology can be confusing, so it helps to separate a few things:
- Status update: short, real time messages during an incident. They answer “what is happening now?” and “what should we do in the next hour?”.
- RFO (Reason for Outage): often a short written summary from your host that explains the immediate technical trigger and how it was fixed.
- Postmortem: a more complete review, usually after the dust has settled. It looks at what failed, why, how the response went, and what to improve.
You can treat the RFO as one input to your postmortem, alongside your own view of business impact and response.
Blameless does not mean “nobody is responsible”
“Blameless postmortem” is a phrase you may hear in reliability circles. The idea is not that people are never accountable. It is that:
- You assume people acted in good faith, with the information and tools they had.
- You look for how the system allowed the mistake or failure to happen.
- You fix conditions and processes, not just individuals.
For example, if a developer deployed a breaking change on a Friday evening, the lesson usually is not “never let that person touch production again”. It is more likely “we need a safer deployment process and clearer change freeze rules”.
Responsibility still exists: actions from both you and your provider should be clearly owned and tracked. The difference is the tone and focus.
How hosting postmortems fit with risk registers, SLAs and uptime guarantees
Postmortems are part of a broader governance picture:
- Risk register: serious incidents often reveal risks you should add or re rate. Our separate guide on designing a hosting risk register shows how to do this.
- SLAs and uptime guarantees: postmortems help you understand whether an incident was within the expected behaviour of your current SLA, or signals a gap between your needs and what the platform can realistically provide. The article what uptime guarantees really mean is a useful reference.
- Compliance and contracts: for regulated businesses, postmortems can underpin internal audits and show that you are managing infrastructure risk in a structured way.
Done regularly, postmortems connect the day to day reality of incidents to the higher level documents that drive your budget, contracts and architecture choices.
Before You Start: Get the Facts and Timeline Straight
A common source of friction in postmortems is people working from different timelines. Users complain at one time. Alerts fire at another. Your host sees a spike slightly earlier or later.
Before you jump into causes, align the basic sequence of events.

What to collect on your side: symptoms, impact and timestamps
From your organisation’s perspective, collect:
- Symptoms: what you and your users saw. For example: “checkout page timing out”, “500 error on login”, “very slow page loads”. Screenshots can be helpful.
- Start and end times: when did the first symptom appear? When did things return to normal for users?
- Impact on users: number of affected users if you know it, or proxy measures like drop in orders, support tickets raised, or internal complaints.
- Business impact: lost revenue (even in rough terms), missed SLAs to your own customers, reputational impact, operational disruption.
- Internal actions: who noticed the issue, who was contacted, and any changes made (configuration, releases, content updates).
Even simple notes in a shared document are fine. The aim is to give your hosting provider a clear view of the incident from your side.
What to ask your hosting provider for: logs, graphs and initial diagnosis
From your provider, you will usually want:
- System timeline: when they first saw abnormal behaviour on your hosting environment, and when they considered it resolved.
- Key graphs: CPU usage, memory, disk I/O, bandwidth, number of requests, HTTP error rates, database queries, depending on the setup.
- Relevant logs: web server errors, application errors, database errors, security events such as blocked attacks.
- Initial diagnosis or RFO: a short technical summary of what they believe happened.
You do not need to interpret every metric yourself. The purpose is to have shared evidence on the table, so you can ask clear questions and follow the reasoning that leads to a root cause.
Clarifying scope: was this a hosting, application or third party issue?
Many incidents cross boundaries between:
- Hosting infrastructure: servers, storage, networking, data centre, virtualisation.
- Application: your CMS, plug ins, custom code, theme, background jobs.
- Third parties: payment gateways, DNS providers, email services, analytics, CDNs.
Using a shared responsibility model helps frame the discussion. The article who owns the outage goes into this in more detail.
During the postmortem, try to agree what part of the system actually failed. For example:
- “The host’s storage cluster had an issue, which affected database performance.”
- “The WooCommerce plug in update created a slow database query under load.”
- “The payment provider’s API was unavailable, so checkouts stalled even though the hosting was healthy.”
This does not have to be perfect on first pass, but it avoids talking at cross purposes and sets realistic expectations about who can change what.
Designing a Blameless Hosting Postmortem Process
Set the tone: ground rules that keep the conversation productive
Simple ground rules can keep reviews from turning into arguments. For example:
- Describe behaviour, not motives: “the alert did not fire” rather than “they ignored alerts”.
- Focus on “what” and “how” before “who”: first understand what happened technically and organisationally, then allocate responsibilities.
- Time box discussions: avoid getting stuck in long debates about less important details.
- Document as you go: keep visible notes that everyone can see and correct.
Agree these upfront with your hosting provider so the session feels collaborative, not adversarial.
Who should be in the room from your side and your provider’s side
For a meaningful 60 to 90 minute review, you typically want:
- From your side:
- Someone who understands the business impact and priorities, such as a product owner, eCommerce lead or digital manager.
- Someone who handles the website technically, such as a developer, technical agency or in house IT.
- The person who owns the contract or relationship with the host, if they are not already present.
- From the provider’s side:
- A technical lead who can explain logs and metrics in plain language.
- Optionally, an account or customer success contact for higher level follow up.
The group should be small enough to keep discussion focused, but broad enough to join up business context and technical detail.
A simple agenda for a 60–90 minute hosting incident review
A straightforward agenda that works for most incidents is:
- Reconstruct the timeline (10–15 minutes)
- Compare user facing times with provider logs.
- Agree on a single, shared timeline.
- Describe impact (10–15 minutes)
- Scale and nature of user impact.
- Operational and financial effects.
- Walk through technical factors (20–30 minutes)
- What went wrong at the infrastructure and application levels.
- How monitoring and alerts behaved.
- How the response unfolded.
- Identify root causes and contributing factors (15–20 minutes)
- Agree improvements, owners and dates (10–15 minutes)
Capture actions in real time and make sure both sides are comfortable with the wording and expectations.
Getting to Real Root Causes (Beyond “The Server Was Busy”)

Symptoms vs causes vs contributing factors
It is useful to distinguish:
- Symptoms: what users saw (“502 errors”, “spinning wheel at checkout”).
- Immediate cause: the direct technical trigger (“database connection pool reached its limit”, “storage node failed”).
- Deeper causes: underlying decisions or conditions (“no read replica for the database”, “all traffic on a single web server”).
- Contributing factors: things that did not cause the incident alone, but made it worse (“peak marketing campaign”, “monitoring not covering that metric”).
When someone says “the server was overloaded”, try to dig one or two layers deeper:
- Why did that level of traffic overload it?
- Why was there no automatic or manual scaling?
- Why did alerts not trigger earlier, or why did we not act on them?
You do not need to run a full formal analysis, but you do want to avoid stopping at surface level statements.
Using logs, metrics and error monitoring without being an engineer
You do not need to understand every technical detail your provider shows you, but some basic questions help:
- Patterns: do you see sudden spikes, slow ramps, or regular bursts? Spikes can suggest attacks or campaigns, gradual increases might point to capacity issues.
- Correlation: do error rates climb just after CPU usage goes high, or when database latency jumps? This links symptoms to specific components.
- Timing: what changed shortly before things went wrong? A deployment, configuration change, new plug in, or external event.
Ask your provider to explain unfamiliar graphs in business language. For example, “this line shows how many database queries the site is making” or “this chart shows how often the server had to reject a request because it was full”.
Common hosting root causes: capacity, single points of failure and configuration
Many incidents fall into familiar categories, such as those described in why websites go down. Typical hosting related root causes include:
- Capacity limits:
- Single server hitting CPU, memory or disk bottlenecks during peaks.
- Database overloaded by slow queries or heavy reports.
- Shared hosting account hitting resource caps.
- Single points of failure:
- Only one web server, one database, or one payment gateway without failover.
- Critical scheduled task running on a single node.
- Configuration issues:
- Missing or misconfigured caching, causing unnecessary load.
- Overly aggressive security rules blocking legitimate traffic.
- Unoptimised WordPress plug ins triggering heavy database usage.
- External dependencies:
- DNS misconfigurations.
- Third party APIs slowing down or failing.
The value of the postmortem is not just naming these patterns, but linking them to specific parts of your setup, so you can decide whether configuration changes or broader architectural changes are needed.
Turning Findings Into Concrete Improvements
Separating quick wins, structural fixes and process changes
To keep postmortems from producing an overwhelming to do list, group actions into three buckets:
- Quick wins: changes that are low risk and can be done in days or weeks. For example:
- Adjusting alerts to trigger earlier.
- Enabling more aggressive caching of static assets.
- Removing a problematic plug in.
- Structural fixes: deeper changes to hosting architecture or application design. These might require planning and budget, such as:
- Moving from shared hosting to virtual dedicated servers for consistent resources.
- Splitting database and application tiers.
- Adding redundancy across availability zones.
- Process changes: improvements to how you and your provider work, such as:
- Introducing a change management checklist.
- Agreeing maintenance windows and communication channels.
- Scheduling regular incident reviews.
Each incident will usually trigger at least one action in each category.
Where architecture changes help: scaling, redundancy and managed services
Some recurring issues only really go away when you adjust your hosting model. Typical examples:
- Scaling: if traffic spikes keep causing slowdowns, consider:
- Vertical scaling (more powerful servers) in the short term.
- Horizontal scaling (multiple web servers behind a load balancer) for more resilience.
- Using a CDN or acceleration layer so static content is served closer to users and your origin servers see less load. For example, the G7 Acceleration Network caches content, optimises images to AVIF and WebP on the fly, and filters abusive traffic before it hits application servers.
- Redundancy: if failures of single components are a pattern, plan for:
- Database replicas or failover instances.
- Multiple web servers.
- Separate backup locations, ideally in a different data centre.
- Managed services: when in house capacity is limited, or mistakes could have serious impact, a managed hosting arrangement can:
- Take on patching, monitoring and incident response.
- Guide architectural decisions based on your risk appetite.
- Provide tuned environments for common platforms such as managed WordPress.
Managed services should be viewed as a way to reduce operational risk and complexity, not as the only valid choice. In some organisations, internal teams will prefer to own the detail, while in others it makes sense to lean on provider expertise, especially for complex eCommerce, compliance sensitive or 24/7 platforms.
Agreeing owners, deadlines and success criteria with your provider
Improvements are only useful if they actually happen. For each action, capture:
- Owner: who is responsible for delivering it, on your side or the provider’s.
- Due date: realistic, considering risk and effort.
- Success criteria: how you will know it worked. For example:
- “Under equivalent peak load, average checkout response time stays under X seconds.”
- “Database failover completes in under Y minutes in tests.”
- “Alerts for 5XX error spikes fire within Z minutes.”
Agree how progress on these actions will be tracked and how you will test that changes have the desired effect.
Keeping Emotions Out Of It: Avoiding the Blame Game With Your Host
Typical traps: “they should have…” vs “we could have…”
Language shapes the tone of the review. Two common traps are:
- “They should have…”: putting all responsibility on the provider for everything that went wrong.
- “There was nothing we could do…”: treating hosting as a black box outside your influence.
More productive phrasing tends to include:
- “We could have…”: acknowledging where internal processes, monitoring, code changes or communication could be improved.
- “How could we together…”: framing improvements as joint work, such as better staging environments, clearer runbooks, or shared testing.
That does not mean excusing genuine provider mistakes, but it keeps the focus on future reliability rather than past frustration.
Using shared responsibility models to frame the discussion
Many misunderstandings come from unclear assumptions about who does what. A simple RACI or shared responsibility matrix, like the one discussed in what “managed” really covers, can help.
In a postmortem, refer back to your agreed model:
- If backups are a provider responsibility, ask how they were verified and restored.
- If application updates are your responsibility, focus on how you test and schedule them.
- If security hardening is shared, identify which controls belong to which party.
This frames the incident less as “host vs client” and more as “did our joint operating model work as planned?”.
When repeated patterns signal it may be time to change provider
Not every pattern can be fixed with process. Reasonable triggers to consider a new hosting model or provider include:
- Repeated outages from the same underlying platform issue, without a credible plan for structural change.
- Persistent gaps between advertised capabilities and what you actually experience.
- Difficulty getting clear information during and after incidents.
- Architectural needs that are clearly beyond your current platform’s design.
Postmortem records make this decision easier. You can look across six or twelve months and see whether things are improving, static or deteriorating, based on evidence rather than isolated memories.
Practical Templates: Questions To Use In Your Next Hosting Postmortem
Core questions for any outage or major incident
You can use these as a simple checklist for almost any hosting related incident:
- What did users experience, and from when to when?
- What systems and components were involved?
- What changed shortly before the incident?
- What is the most plausible sequence of technical events?
- Which controls (monitoring, failover, rate limiting, backups) were supposed to protect us, and how did they behave?
- What went well about our response?
- What slowed us down or made the impact worse?
- What are the top three improvements we will implement?
Extra questions for security incidents and payment issues
For security incidents, or anything involving payments and personal data, add:
- What type of event was it (for example, brute force attempt, exploited vulnerability, misconfiguration)?
- Was any data exposed, altered or at risk, based on current evidence?
- Which security controls worked, and which did not? For example, WAF rules, rate limiting, 2FA, server hardening.
- Do our current web hosting security features and policies match our risk profile?
- Are any regulatory or contractual notifications required?
- For payments, did the issue involve the payment gateway, application code, or underlying hosting?
- Do we need to review our PCI conscious hosting approach or payment flow?
Security postmortems often also feed into updates of your incident response plan and staff training.
Extra questions for performance and peak‑traffic incidents
For slowdowns at peak load or during campaigns, consider:
- What was the traffic pattern compared with a normal day?
- Which pages or API routes were most heavily hit?
- Did caching (at the application, server or network layer) behave as expected?
- How much headroom did we have in CPU, memory, database, and network at the worst point?
- Could using a CDN or features like the G7 Acceleration Network have offloaded some of the work from the origin servers?
- Did any particular plug in, report or background job dominate resources?
- What changes can we test before the next known busy period?
Performance postmortems often lead to architecture and optimisation work, not just short term tuning. For WordPress and WooCommerce, this may include reviewing plug ins, database indexes and image handling, alongside the hosting platform itself.
Making Postmortems Part of Your Normal Hosting Governance

How often to review incidents and near‑misses
Postmortems do not need to be reserved only for major outages. A practical rhythm is:
- After every significant incident: anything that caused noticeable user impact or urgent work out of hours.
- Monthly or quarterly reviews: look across all incidents and near misses to spot patterns. A “near miss” could be an alert that almost breached thresholds, or a failed deployment that was caught before going live.
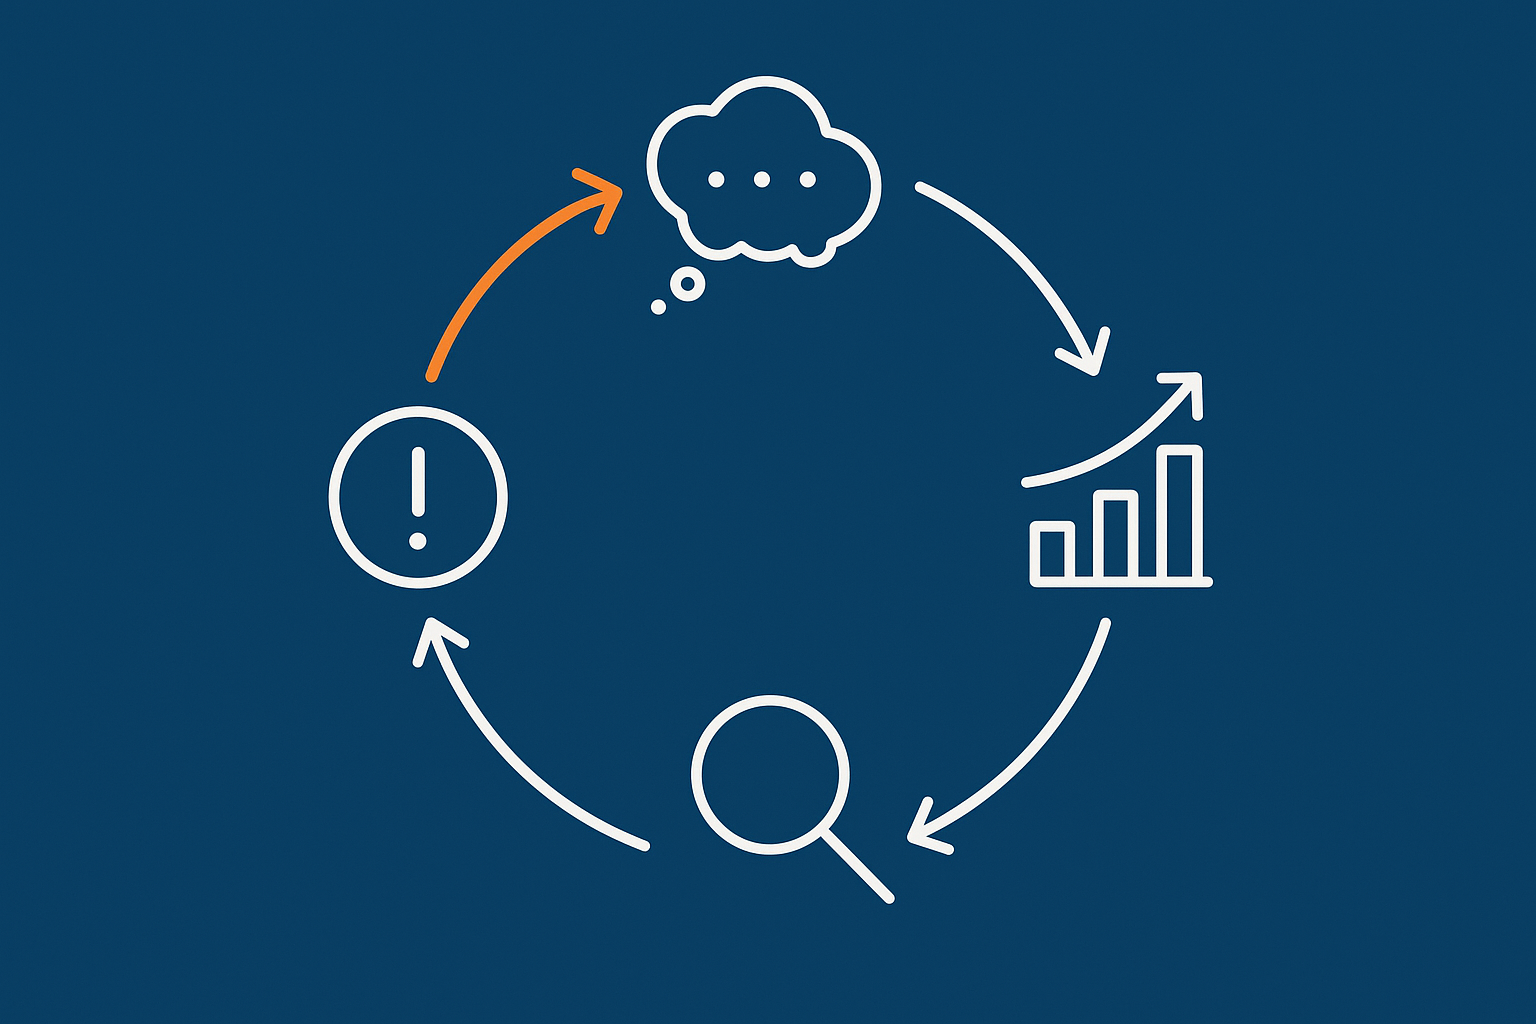
This keeps the feedback loop tight: incidents feed into learning, which feeds into improvement, rather than becoming isolated bursts of stress.
Linking postmortems to your risk register, capacity planning and DR plans
To get full value from incident reviews, link them back into your ongoing planning:
- Risk register: update likelihood and impact scores based on real incidents. Add new risks where patterns emerge.
- Capacity planning: use performance and traffic incident data to inform how you size servers, databases and network for future peaks.
- Disaster Recovery (DR) and Business Continuity: serious incidents should trigger a review of your backup and DR assumptions. Our guide on building a realistic disaster recovery plan provides a useful structure.
Over time, you should see incidents shifting from surprising shocks to expected failure modes that your architecture and processes are designed to handle.
What to expect from a mature managed hosting or virtual dedicated setup
In a more mature arrangement, whether in house or with a provider, you can reasonably expect:
- Documented incident response and communication processes.
- Proactive monitoring and alerting, tuned for your workloads.
- Regular performance and capacity reviews, especially before known peaks.
- Structured postmortems for significant events, with clear outputs.
- Hosting environments designed for your risk profile, for example through well sized virtual dedicated servers and appropriate redundancy.
- Use of performance tooling such as web hosting performance features that support caching, optimisation and intelligent traffic handling.
Even with these in place, incidents will still happen occasionally, but their impact and recovery time should steadily improve.
Next Steps: Turning Your Last Outage Into Your Most Useful Data Point
A short checklist before your next postmortem meeting
To prepare for a constructive session with your hosting provider, you can:
- Write down your own timeline of the incident, with symptoms and business impact.
- Ask your provider in advance for their technical timeline and any RFO.
- Decide who will attend from your side and what decisions you want to reach.
- Agree basic ground rules and a simple agenda.
- Set expectations about outputs: at least a short written summary and a small set of actions with owners.
This keeps the meeting focused and increases the chance that it leads to real improvements rather than just a re telling of the incident.
When to revisit your hosting model or move to a more resilient platform
Finally, use patterns from multiple postmortems to inform larger decisions. It may be time to revisit your hosting model if you see:
- Repeated capacity related incidents during expected peaks.
- Difficulty implementing the redundancy or controls your risk profile requires.
- Operational effort that is no longer sustainable for your internal team.
In those cases, a move towards a more resilient architecture, or towards a managed hosting or virtual dedicated server setup, can reduce day to day risk and free your team to focus more on your application and users.
If you would like to talk through a recent incident or sense check your current setup, you are welcome to contact G7Cloud to discuss which hosting architecture and operating model best matches your risk, budget and internal capacity.

