Understanding Linux Disk I/O on a VPS: When Storage Becomes Your Real Bottleneck
Who This Disk I/O Guide Is For (And Why Your VPS Feels Slow)
This guide is for people running Linux VPS servers who feel that “something is slow” but are not sure why. You may be hosting WordPress, WooCommerce, Laravel, custom PHP or other web applications.
We will focus on disk I/O bottlenecks. In other words, times when your storage is holding you back more than CPU or RAM. You do not need deep Linux experience, but you should be comfortable using SSH and running commands.
If you also want to understand CPU and process related issues, you might find it helpful to read our guide on load average and top on a busy VPS alongside this one.
Typical symptoms when storage is the problem
Disk I/O problems often show up in slightly “soggy” performance rather than a complete outage. Some common signs include:
- Pages that start loading quickly but then hang before finishing, especially on database heavy views like WooCommerce reports.
- SSH commands that pause for a second or two before printing anything, especially file related commands like
lsornano. - Database queries that feel fine off peak but crawl during backups, cron jobs or log rotation.
- Loads that spike in
topor your host’s graphs even though CPU usage is not maxed out. - Frequent “504 Gateway Timeout” or “Error establishing a database connection” messages under load.
On WordPress sites, this often looks like:
- WooCommerce order list, analytics or product search being very slow.
- The back end “spinning” while saving posts or products.
- Very slow media library views, especially when searching or filtering.
How disk I/O bottlenecks feel different from CPU or RAM limits
Disk issues behave differently to pure CPU or RAM pressure:
- CPU bound: the server does the work quickly but cannot keep up with the number of tasks. CPU graphs are high, pages may render slowly but fairly consistently.
- RAM bound: the server runs out of memory, starts swapping to disk and everything gets sluggish or unstable. You may see the OOM killer in logs.
- Disk I/O bound: you have CPU and RAM available, but processes sit waiting for the disk to read or write data. Performance often feels “stop start”.
In top, disk I/O problems often show as:
- High load average (especially the first number) while CPU usage is not maxed.
- High
wa(I/O wait) in the CPU usage line.
We will look at this in more detail with commands later.
A quick word on shared VPS storage vs virtual dedicated servers
Most smaller VPS plans use shared storage. Your virtual machine sits on a host alongside many others, all using the same underlying disks. The platform works to share performance fairly, but at busy times you can feel slowdowns caused by other servers on the same storage.
With virtual dedicated servers (VDS), you typically have a larger share of dedicated CPU and more predictable access to fast SSD storage. That does not magically fix poor application behaviour, but it gives you a more stable baseline to work from, especially for database heavy workloads.
You can absolutely tune and troubleshoot on a regular VPS. The rest of this guide will help you work out whether your bottleneck is architectural (shared storage limits) or local to your applications.
Linux Disk I/O in Plain English
What disk I/O actually is
Disk I/O means “disk input and output”. It is simply the act of reading from or writing to storage.
On a web server, almost everything touches the disk at some point:
- The web server and PHP read your code and static files from disk.
- MySQL reads and writes database pages and log files.
- Logs, backups and caches are all written to disk.
Think of disk I/O as the conversation between the CPU and the storage layer. If that conversation is slow or congested, your otherwise fast server ends up waiting around.
Key concepts: latency, throughput, IOPS and queue depth
You will see a few key terms when looking at disk performance.
- Latency: how long a single I/O operation takes. Typically measured in milliseconds (ms). Lower is better.
- Throughput: how much data you can move per second, such as MB/s. Useful for large sequential operations like backups.
- IOPS: “input/output operations per second”. A count of how many reads/writes you can do each second. Important for workloads with lots of small random operations, such as busy databases.
- Queue depth: how many I/O operations are waiting to be processed. A very long queue with high latency usually means the disk is a bottleneck.
Simple picture:
- High throughput but poor IOPS is fine for big streaming tasks but not great for many tiny queries.
- High IOPS with low latency is ideal for database work.
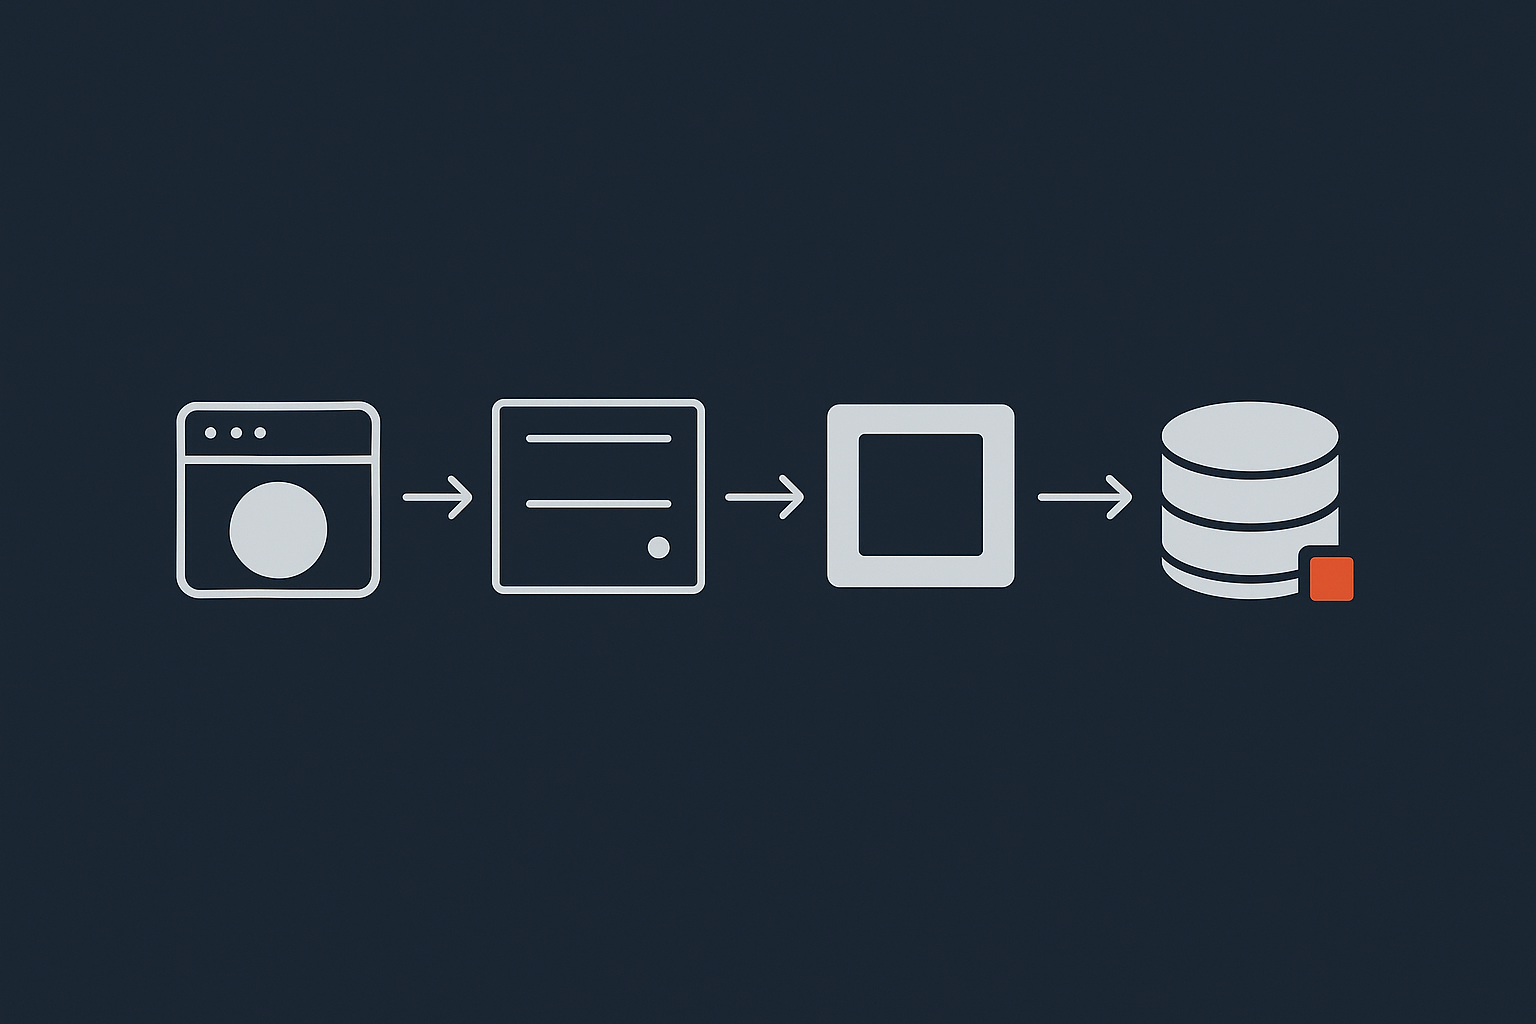
How this interacts with typical web stacks (PHP, MySQL and WordPress)
In a typical LAMP or LEMP stack:
- Your web server (Apache or Nginx) serves static files and hands dynamic requests to PHP.
- PHP code runs your application or WordPress and sends queries to MySQL or MariaDB.
- The database reads and writes from its data files on disk.
Disk I/O affects different parts:
- PHP: usually less sensitive to disk, but heavy frameworks or large autoloaders can cause more file reads.
- MySQL: very sensitive. Slow disk means slow queries, especially without good indexes or with bloated tables.
- WordPress: relies on many small queries. Poor IOPS or high latency will surface as slow dashboards, searches and admin pages.
Front end performance work such as image optimisation and caching can reduce how often PHP and MySQL have to touch the disk in the first place. For example, the G7 Acceleration Network can convert images to AVIF and WebP on the fly and filter abusive bots before they hit PHP, which cuts both bandwidth and disk I/O usage without changing your WordPress plugins.
First Checks: Is Disk I/O Really Your Bottleneck?
Reading your host’s resource graphs: CPU vs RAM vs I/O
Before logging in by SSH, it is worth looking at your hosting control panel graphs.
Look at:
- CPU: is it consistently high during slow periods?
- RAM: are you close to your limit? Are there swap usage spikes?
- Disk I/O: do you see I/O usage or latency spiking when things feel slow?
If disk I/O graphs spike while CPU and RAM look comfortable, that is a strong hint that storage is the bottleneck. For more help reading these graphs, especially for WordPress sites, see our guide on how to read WordPress hosting resource graphs.
Using top and iotop to spot I/O bound processes
Next, look from inside the server.
What this solves: top and iotop show which processes are waiting on disk. This tells you whether the issue is system wide storage or one misbehaving app.
Run:
topWhat it does: top shows real time CPU, memory and load information.
Things to look for:
- The line starting with
%Cpu(s). If thewa(I/O wait) value is noticeably higher than 0 for sustained periods (for example 10 percent or more) then processes are spending a lot of time waiting for disk. - High load averages in the first numbers at the top right, with actual CPU usage not maxed, can also hint at I/O wait.
To see which processes are doing the I/O, use iotop.
Note: iotop needs root privileges. Use sudo if you are on a non root user.
sudo iotopWhat it does: iotop shows processes by disk read/write usage in real time.
What to expect:
- You may see
mysqldormariadbd,php-fpmorapache2, or backup and log rotation processes appear near the top. - If nothing significant appears, your bottleneck may be outside the server, such as network latency.
To exit both tools, press q.
Using iostat / dstat / sar for a time based view
Momentary snapshots can miss short spikes. Tools like iostat, dstat and sar give a rolling or historical view.
We will cover installation and usage in more detail later, but at a high level:
iostatshows I/O statistics by device with metrics like%utilandawait.dstatcan show CPU, network and disk in one view over time.sarcan log stats to a file so you can review slow periods after the fact.
Safety notes before you start running tests
Monitoring commands like top, iotop, iostat, dstat and sar are safe to run. They only read information, they do not change your system.
Later in the guide we will talk briefly about performance tests that write to disk. Keep these points in mind:
- Avoid running heavy benchmarks on a live production server during peak times.
- Prefer to test on a staging VPS or outside business hours.
- If your provider offers snapshots, take one before making large configuration changes.
- Keep a simple log of the changes you make so you can undo them if needed.
Hands On: Basic Disk I/O Monitoring Commands (With Explanations)

Install the tools you will need
What this solves: by default, not all distributions include iotop, iostat or sar. This step adds them.
On Debian / Ubuntu:
sudo apt update
sudo apt install sysstat iotop dstat
On CentOS / AlmaLinux / Rocky Linux:
sudo yum install sysstat iotop dstator on newer systems:
sudo dnf install sysstat iotop dstatWhat this does:
sysstatprovidesiostatandsar.iotopgives per process I/O usage.dstatgives a combined view of system metrics.
Adjusting or undoing: you can remove any of these later with your package manager, for example sudo apt remove iotop. They are light tools and safe to keep installed.
Quick interactive checks with top, iotop and df
1. Check system load and I/O wait with top
topLook for:
waunder%Cpu(s). A consistently high value indicates processes spending time waiting for disk.- Processes with high
STATincludingD, which indicates uninterruptible sleep, often I/O related.
2. See which processes are using disk with iotop
sudo iotopColumns to notice:
DISK READandDISK WRITE: show current throughput per process.SWAPINandIO: show percentages of time the process is swapped in or waiting for I/O.
If you see mysqld at the top with heavy I/O, database tuning or queries are the likely next target.
3. Check disk usage with df
This does not measure speed, but a full disk can cause strange performance issues.
df -hWhat it does: shows disk usage of all mounted filesystems in human readable units.
Look at the Use% column. If any filesystem is at or near 100 percent, you should free space before doing deeper performance work.
Be careful: do not delete files you are unsure of. Logs and old backups are usually safest to trim first. If in doubt, take a snapshot or backup before removing large files.
Understanding iostat output: %util, await and svctm
What this solves: iostat gives a clearer view of how busy the disks are and how long I/O takes.
Run:
iostat -x 2 5What it does:
-xshows extended statistics.2is the interval in seconds.5is the number of reports.
You will see a table per device. Key columns:
%util: percentage of time the device was busy. Values consistently close to 100 percent indicate saturation.await: average time (in ms) for I/O requests to be served. Higher values mean more waiting.svctm: average service time in ms (on some systems). Long gaps betweensvctmandawaitsuggest queuing delays.
As a very rough guide:
%utilunder 50 percent and lowawaitusually means disk is not the issue.%utilover 90 percent with highawaitduring slow periods strongly points to disk I/O as the bottleneck.
Press Ctrl + C to stop.
Using sar to capture I/O during a slow period
What this solves: if your site is slow at certain times when you are not watching the server, sar can record stats for later review.
First ensure that sysstat data collection is enabled. On many systems it is turned on automatically after installation, but you may need to enable it in /etc/default/sysstat or /etc/sysconfig/sysstat depending on distribution.
Warning: editing files under /etc changes system behaviour. Take a copy of any file before editing it, for example sudo cp /etc/default/sysstat /etc/default/sysstat.bak, so you can restore it if something goes wrong.
Once enabled and running, you can view historical I/O stats with:
sar -d 1 10What it does:
-dshows block device statistics.1 10prints data every 1 second for 10 intervals.
For historic data, omit the interval and count:
sar -dThis will show per device metrics for the current day, including tps (transfers per second) and await (average wait). Check the times that align with your slow periods.
To adjust how frequently sar collects data, edit its cron or systemd timer as documented in the official sar manual. Always keep a backup of the original config.
Common Disk I/O Bottlenecks on Small VPSs
Slow or oversold storage on shared VPS platforms
On some shared VPS platforms, many virtual machines share the same underlying storage. If the storage array is heavily loaded, you will see high disk latency even when your own usage is modest.
Signs include:
- High
awaitand%utiliniostateven when your own I/O traffic appears low. - Performance varying a lot by time of day without clear changes in your own traffic.
You have limited control over this. Application tuning and caching can help reduce your own I/O, but if the platform is consistently saturated, moving to a plan with faster or less contended storage, such as a virtual dedicated server, usually gives more predictable results.
One noisy neighbour vs your own noisy apps
On shared storage, a single busy VM can cause high latency for others. From inside your VPS, you cannot directly see your neighbours, but you can often tell if it is external or internal:
- If
iostatshows high%utilandawaitwhileiotopshows low per process I/O, the problem is likely outside your VPS. - If
iotopshows your own processes doing heavy I/O, then you have a local cause to tune, such as backups or poorly indexed queries.
Database issues: bloated tables and unindexed queries
Bloated or unoptimised databases are one of the most common sources of unnecessary disk I/O.
Examples:
- Very large
wp_postmetaorwp_woocommerce_order_itemstables storing years of data with no clean up. - Missing indexes on columns used in
WHEREorORDER BYclauses. - Plugins that log every hit or event into large tables.
Effects:
- More data pages must be read from disk per query.
- Buffer pools cache less effectively, causing more physical disk reads.
Cleaning and optimising a production database should always be done carefully, preferably with a full backup first and, for WordPress, on a staging copy if possible. Our step by step guide on cleaning and optimising a bloated WordPress database covers this in depth.
Log files, backups and cron jobs hammering the disk
Batch tasks can quietly load the disk in the background:
- Daily backups writing large archives to the same disk.
- Log rotation compressing big log files.
- Security scans reading many files.
Symptoms:
- Site slowdowns at regular times (for example midnight) that align with cron jobs.
- High disk write throughput in
iotopby backup tools or compression utilities.
Mitigation is usually straightforward:
- Move backups to run off peak.
- Store backups on external storage where possible.
- Limit logging verbosity where safe.
Swap and memory pressure causing extra I/O
When your server runs low on RAM, the kernel moves inactive memory pages to disk (swap). Accessing this swapped memory later causes extra disk I/O and can significantly slow everything down.
Signs:
topshows swap usage growing over time.iotopshows swap activity and highSWAPINpercentages.
Fixes:
- Reduce memory usage by tuning services or PHP worker counts.
- Add more RAM or move to a plan with more memory if needed.
- Use a modest amount of swap as a safety net, not as normal working space.
Web and WordPress Examples: When Disk I/O Bites in Real Life
WooCommerce admin and reports feeling painfully slow
WooCommerce admin pages and reports often run heavier queries across order and product tables. On a disk constrained VPS, each query may cause multiple disk reads.
Typical pattern:
- Frontend product pages may feel okay.
- The “Orders” list, reports or analytics stall, sometimes even timing out.
iostatduring these actions showsmysqlddriving high%utilandawait.
Improvements often come from:
- Cleaning old transients and sessions.
- Archiving or summarising old order data where feasible.
- Ensuring queries are properly indexed.
- Using page caching to reduce the number of dynamic admin hits when possible.
Large WordPress databases and media libraries
As sites grow, databases and uploads directories can become heavy:
- Hundreds of thousands of posts, revisions and comments.
- Gigabytes of media files stored locally.
Effects on disk I/O:
- Larger tables mean more disk seeks and pages read per query.
- Large file trees take longer to scan for backups, security scans and media related tasks.
In some cases, moving media to external storage or a CDN can help, provided it is implemented thoughtfully. Our guide on offloading WordPress media to external storage walks through the trade offs.
Heavy plugins, search and product filters hitting the database
Certain plugins naturally produce heavy database traffic:
- Advanced search and faceted filtering.
- Report generators.
- Analytics and tracking tools.
On limited disk I/O, each extra query competes for disk time with everything else.
Mitigations include:
- Using specialised search solutions that keep most data in RAM optimised indexes.
- Scheduling heavy reporting tasks off peak.
- Reviewing and disabling unnecessary features or plugins.
Reducing Disk I/O Load Without Rebuilding Everything
Fix application side causes first
It is usually easier and cheaper to reduce how much I/O your application does than to change hardware tiers.
Useful steps:
- Identify and disable unnecessary plugins or modules.
- Audit scheduled tasks and reduce frequency where safe.
- Trim old data at the application layer (for example delete unused post revisions, transient data, abandoned carts beyond a certain age).
Always make a backup before bulk deletions and test on staging if possible.
Use caching to serve more from RAM instead of disk
Caching reduces how often you need to generate pages dynamically and hit the database.
- Page caching: full HTML pages stored ready to serve. Great for blogs and brochure sites.
- Object caching: query results and objects stored in memory (Redis, Memcached). Helps database heavy sites like WooCommerce.
Benefits for disk I/O:
- Fewer PHP executions and database queries.
- More repeated content delivered from RAM or local cache.
At the network edge, services such as the G7 Acceleration Network can cache and compress responses and images before they even reach your server, which further reduces disk, CPU and bandwidth pressure.
Clean up and optimise your database safely
Database tidy up is one of the highest impact ways to reduce disk I/O, but it must be done carefully.
Safer practices:
- Always take a full database backup before structural changes or large deletes.
- Prefer application level tools that understand your schema (for example WordPress plugins with good reputations) over manual SQL when you are new.
- Test changes on a staging copy.
Common clean up tasks:
- Removing spam and trashed comments.
- Clearing expired transients.
- Limiting the number of stored revisions per post.
All of these reduce table sizes and the amount of data that needs to be read from disk per query.
Taming logs, backups and cron jobs
Even well configured applications can be affected by background tasks.
Steps to consider:
- Check
/var/logand application log directories for very large log files. Rotate and compress them if appropriate. - Configure your backup system to store archives on a different storage tier or at least run large backups off peak.
- Review
crontab -land system cron directories to find jobs that might be heavy and reschedule them if needed.
Warning: do not delete logs or backup files unless you are certain they are no longer needed. Prefer renaming or moving them out of the way first, and ensure you keep at least one known good backup copy elsewhere.
When offloading media storage actually helps
Moving media to external storage (S3 compatible services, CDNs) can:
- Reduce the size of your main filesystem.
- Lower backup times and disk churn.
However, it is not a universal fix. Poorly integrated external storage can add latency to image loads. The key is to:
- Use URL rewriting or carefully configured plugins.
- Keep copies close to your users via a CDN.
When done correctly, your main VPS disk has less read and write activity, which helps keep I/O more stable under load.
Storage Architecture Choices: When Hardware Really Matters

SSD vs HDD in 2025: what really changes for your VPS
Most modern VPS plans use SSD storage. Compared to HDDs, SSDs provide:
- Much lower latency.
- Much higher IOPS.
For database heavy workloads, SSD is effectively essential. On HDD based platforms, even moderate random I/O can cause noticeable pauses. If your host still offers spinning disks for general purpose VPS, it is usually worth choosing SSD unless your workload is very sequential and throughput heavy.
Local SSD, network storage and RAID in simple terms
Storage for VPSs is typically built from a mixture of:
- Local SSD: disks physically attached to the host node. Very fast, but individual disk failures must be handled by RAID and backups.
- Network storage: centralised storage accessed over a fast network fabric. Easier to manage and more flexible, but end to end latency depends on both the storage and the network.
- RAID: multiple disks combined for redundancy and/or performance. RAID does not replace backups but helps keep systems online after a disk failure.
As a VPS user, you normally cannot choose the exact RAID level or layout, but you can choose platforms that invest in fast SSD arrays and careful isolation.
Why virtual dedicated servers often give more predictable I/O
Virtual dedicated servers usually have:
- A higher guaranteed share of the underlying storage performance.
- Fewer neighbours sharing the same disks.
- More consistent CPU and RAM allocations.
This predictability matters for I/O heavy workloads such as:
- Busy WooCommerce shops and membership sites.
- Custom reporting and analytics systems.
- Applications that run regular heavy batch jobs.
You still need good configuration, but you spend less time fighting random storage contention.
When managed VDS is the sensible choice for I/O heavy workloads
Managing an I/O intensive server long term involves:
- Regular kernel and package updates.
- Database tuning and query analysis.
- Monitoring I/O metrics and alerting.
- Planning capacity as data and traffic grow.
If your primary goal is to run one or two business critical sites without becoming a part time systems administrator, a managed VDS can be a sensible option. G7Cloud’s managed virtual dedicated servers offload that ongoing tuning and monitoring so you can focus more on the site or application itself while still benefiting from predictable storage performance.
Testing Disk Performance Safely (Without Harming Live Sites)
Why simple benchmarks like dd can mislead you
You will often see commands like:
dd if=/dev/zero of=/tmp/testfile bs=1G count=1 oflag=dsyncThese can tell you something about raw throughput, but they are limited:
- They often test a single large sequential write, which is unlike most database workloads.
- They may be influenced by cache, giving unrealistically good results.
- They can interfere with other workloads by filling caches or consuming I/O bandwidth.
It is usually better to rely on extended monitoring of real workloads rather than chasing synthetic benchmark numbers on a busy production VPS.
Low risk tests you can run on a busy VPS
If you do want to test, prefer low impact approaches:
- Use
iostat,sarandiotopduring realistic loads. - Time specific operations that matter to you, for example “how long does a WooCommerce report run during peak vs off peak while watching I/O stats?”.
Any test that writes large files or hammers the disk should be run off peak, or ideally on a clone of your server without live traffic.
Safer ways to compare hosts or plans
When comparing platforms:
- Deploy the same test application and database on a staging VPS with each host or plan.
- Use simulated or recorded traffic to exercise realistic paths.
- Monitor application response times plus
iostatandsaroutput during the tests.
This gives a more honest view of how disk I/O behaves under your real workload rather than only synthetic benchmarks.
Putting It Together: A Simple Disk I/O Troubleshooting Checklist
Step by step: from symptom to root cause
- Confirm the symptom:
- Note times and actions that feel slow.
- Check host graphs:
- See whether CPU, RAM or disk I/O spikes match slow periods.
- Use
top:- Check
wa(I/O wait) and load average.
- Check
- Use
iotop:- Identify which processes are using the disk during slowdowns.
- Use
iostat -x:- Check
%utilandawaitper device.
- Check
- Correlate with application activity:
- Are backups, cron jobs or specific admin pages triggering high I/O?
- Reduce application I/O:
- Apply caching, database cleanups, schedule heavy tasks off peak.
- Re test:
- Repeat the commands to see whether
awaitand%utilhave improved.
- Repeat the commands to see whether
- Review platform limits:
- If you are still I/O bound despite a lean application, consider a higher performance or less contended storage tier.
What to monitor over time so problems do not surprise you
To avoid surprises, keep an eye on:
- Disk usage (
df -hand host graphs) so you do not hit 100 percent capacity unexpectedly. - Historical I/O latency (
sar -dreports if you configure them). - Database growth and table sizes.
- Backup durations and log sizes.
Automated monitoring that alerts you when thresholds are crossed can be helpful, but even a simple monthly check in review can catch trends early.
When to stop tuning and move to a different hosting tier
Good tuning can stretch a VPS surprisingly far, but there is a point where storage limits are structural rather than configuration related. It may be time to move up when:
- You have reduced unnecessary plugins, enabled caching and cleaned the database, yet
%utilremains high during normal usage. - Your slow periods clearly align with platform wide I/O contention out of your control.
- Your data set and traffic are growing steadily and you need room for that growth.
At that stage, a move to a plan with faster or less contended SSD storage, such as a virtual dedicated server, often makes more sense than ever more complex tuning.
Where to Go Next
Useful related G7Cloud guides for further reading
- Monitoring a Linux web server with built in tools for a deeper look at
top,iotopandsar. - Practical capacity planning for VPS and VDS to translate what you have learned into concrete upgrade decisions.
Deciding between tweaking your VPS and moving to managed hosting
You now have the basics to recognise when disk I/O is your bottleneck and to make sensible, low risk improvements. For many small sites, a bit of caching, database care and careful scheduling of backups is enough to keep things healthy.
If you are running WordPress or WooCommerce as a core part of your business and would rather have someone else handle day to day server updates, monitoring and performance tuning, it may be worth exploring G7Cloud’s managed WordPress hosting or managed virtual dedicated servers. Both are designed to give you stable, predictable performance while you focus on your site and customers, not on disk metrics.

