
Who this guide is for (and why resource graphs matter)
Resource graphs tend to be ignored until something goes wrong. Then you open your hosting control panel and see a mess of lines, peaks and percentages that may or may not relate to why your site is slow.
This guide is for:
- UK businesses running WordPress or WooCommerce who have seen slow pages, 502/504 errors or random timeouts.
- Site owners who have been told to “upgrade your hosting” but are not sure if resources are really the problem.
- Teams on shared or virtual dedicated servers with dedicated CPU and RAM who want to understand if they are close to any limits.
Typical situations where graphs suddenly become interesting
Most people only open their graphs in a few situations:
- You launch a campaign, traffic jumps and the site starts to crawl.
- Your WooCommerce checkout hangs at busy times or during sales.
- Your host warns that you are “hitting limits” or “using too much CPU”.
- Google Search Console shows Core Web Vitals warnings and you want to know if the server is partly to blame.
- Backups, imports or report exports run for ages and staff complain the admin is “unusable in the mornings”.
In all these cases, the graphs are one of the few hard pieces of evidence you have. Reading them properly helps you avoid guesswork and endless blame-shifting between hosting, plugins and developers.
What you will be able to do after reading
By the end of this guide you should be able to:
- Recognise what CPU, RAM and disk I/O graphs are actually telling you.
- Tell the difference between healthy peaks and serious bottlenecks.
- Link slow periods on your site to patterns in resource usage.
- Decide when you really need more resources vs better optimisation.
- Give your hosting provider or developer specific, useful evidence rather than vague “it was slow” complaints.
If you want a deeper dive into how these metrics tie into Time to First Byte, there is also a dedicated article on reducing WordPress TTFB on UK hosting.
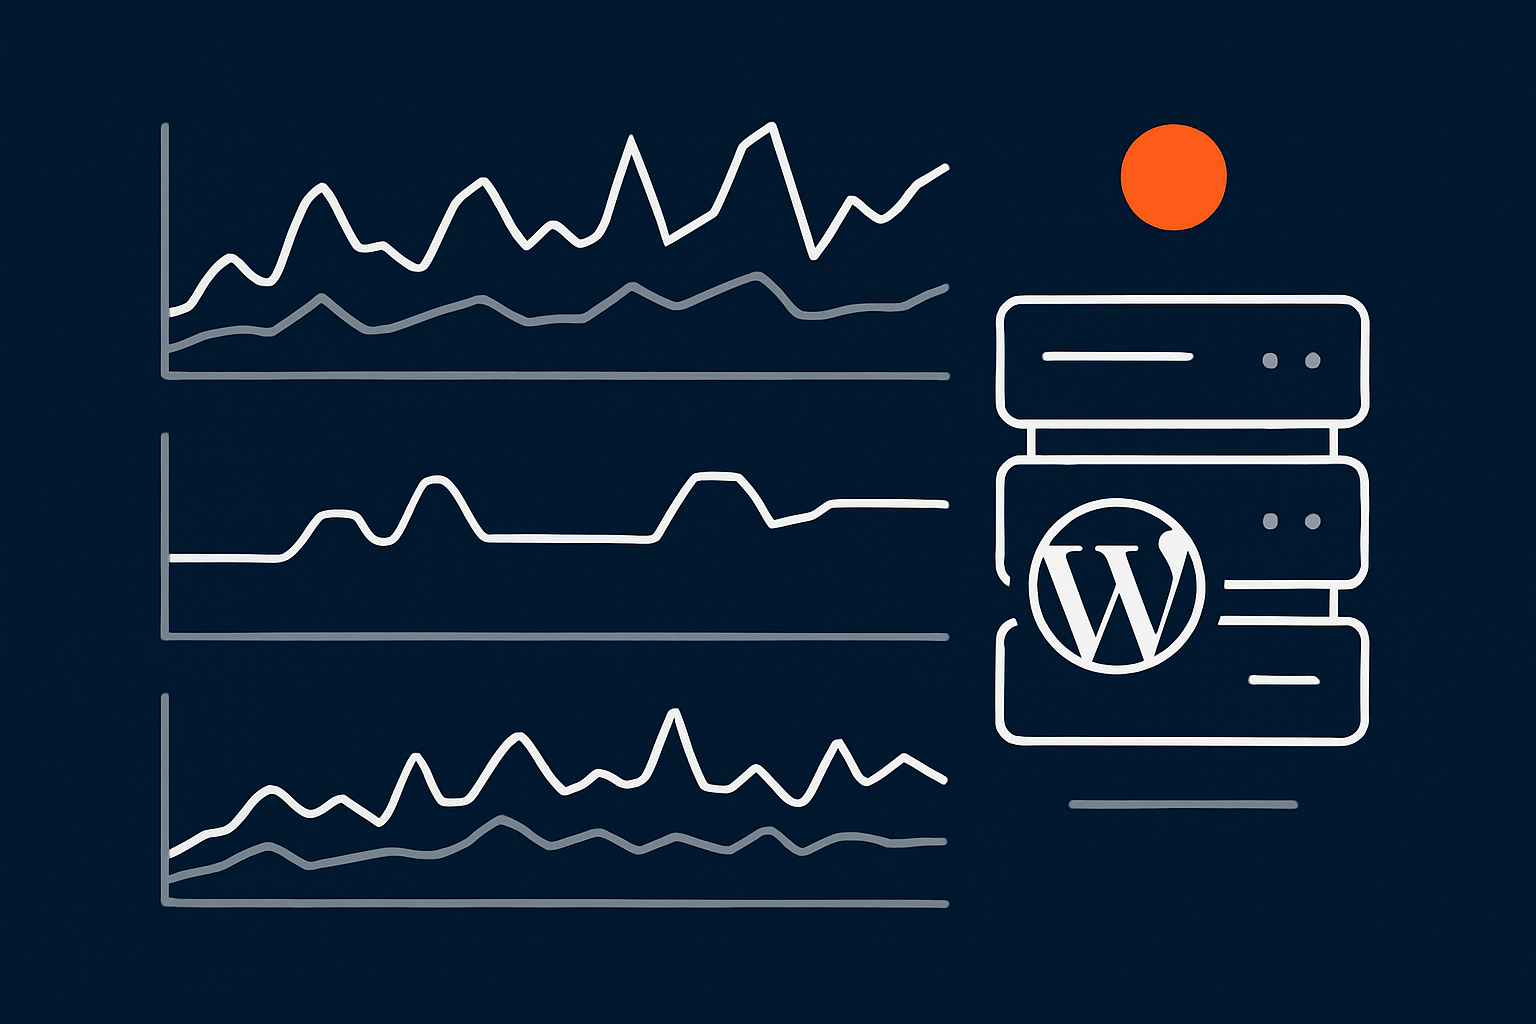
First, what a WordPress hosting resource graph is actually showing
A typical hosting resource graph is a timeline of how hard your server has been working. Each metric is usually averaged over short periods (for example 1, 5 or 15 minutes) and plotted as a line.
Where you normally see these graphs
You will normally find resource graphs in places like:
- cPanel or Plesk under “Resource Usage” or “Statistics”.
- A managed WordPress dashboard from a provider offering managed WordPress hosting plans.
- Cloud or VPS panels such as DigitalOcean, AWS Lightsail or a provider’s own VDS dashboard.
Although the designs vary, the core idea is the same: show how CPU, memory, disk and network have changed over time so you can match them to real-world events on your site.
Key metrics in plain English: CPU, RAM, disk I/O, processes, bandwidth
- CPU
How “busy” the server’s processors are. WordPress uses CPU to execute PHP code, run database queries and process background tasks like cron jobs and feeds. - RAM (memory)
Short-term working space for the server. PHP, MySQL, caching layers and the operating system use RAM to avoid hitting disk for every operation. - Disk I/O
How much reading and writing is happening on the storage. WordPress hits disk when loading PHP files, accessing the database files, reading themes/plugins and storing uploads, backups and logs. - Processes / PHP workers
The number of PHP or web server processes currently handling requests. On many platforms, each active visitor request maps to a PHP worker. - Bandwidth / network
How much data is being sent to and from your server. This reflects visitor traffic, image and file downloads, APIs, search bots and any abusive crawlers.
Why high numbers are not always bad (and low numbers are not always good)
It is easy to treat high percentages as “bad” and low as “good”. Reality is more nuanced:
- A burst of 90% CPU during a sale with fast page loads and no errors can be absolutely fine.
- Consistent 15% CPU with slow pages could point to poor caching, heavy images or slow third party scripts rather than server strain.
- RAM that looks “full” on Linux is often normal because the system uses spare memory as cache.
- Flat, near zero graphs can mean your site is light, or that aggressive caching is doing its job, or that something is broken upstream and traffic is not reaching PHP.
The rest of this guide focuses on reading patterns, not just the numbers.
CPU usage for WordPress: what those spikes really mean
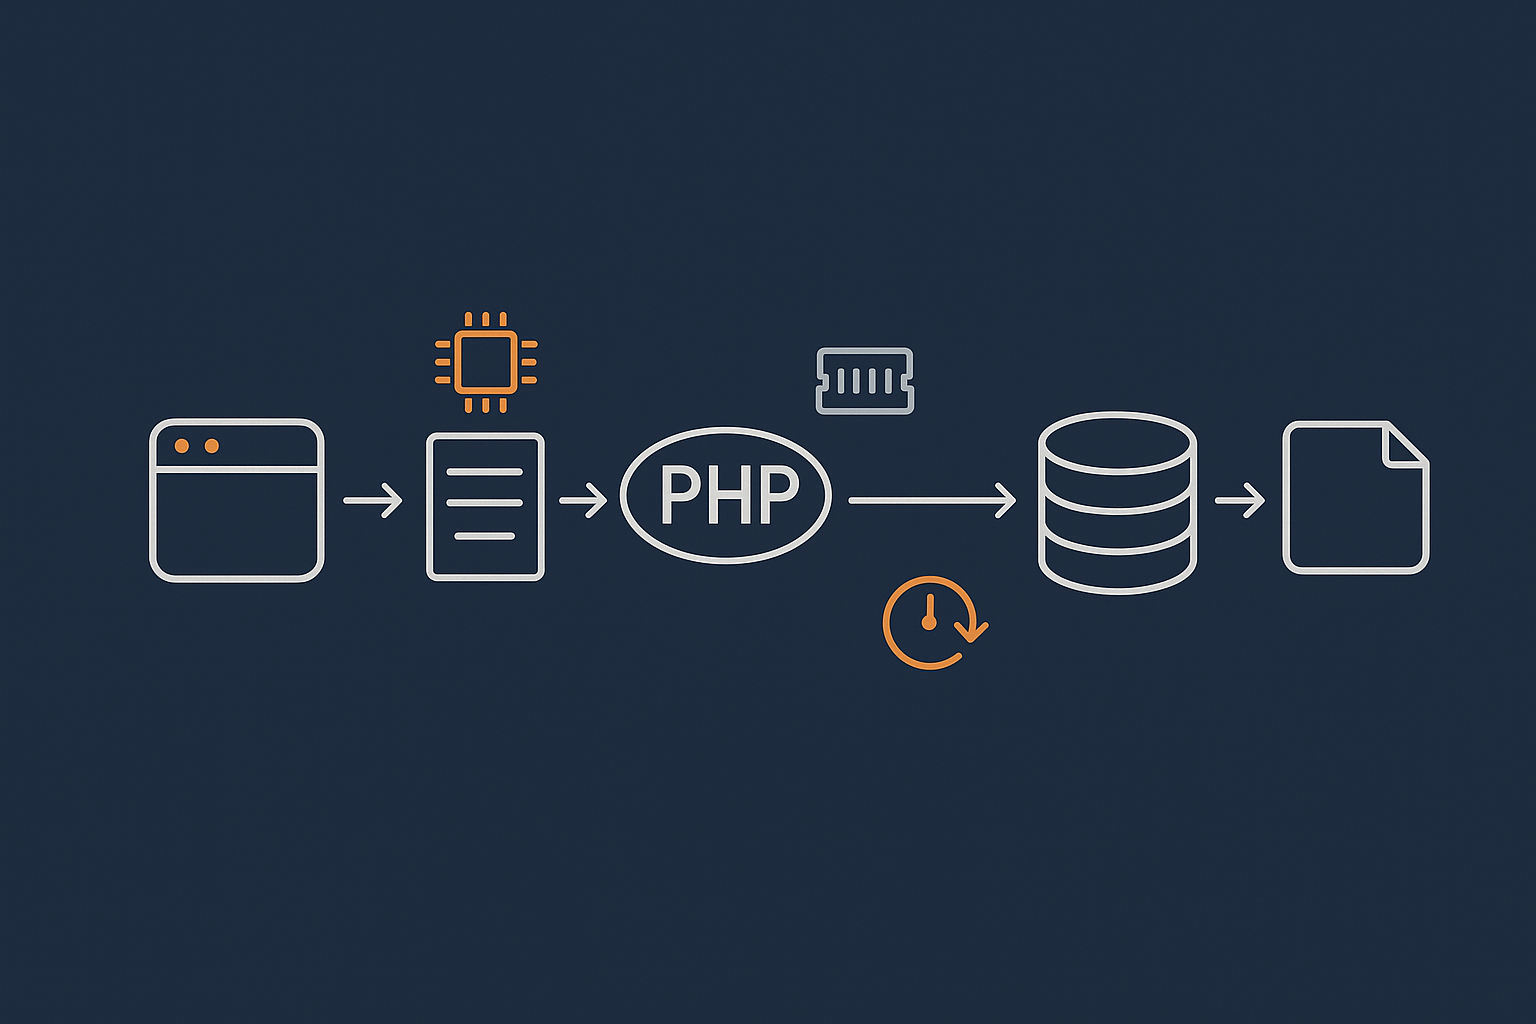
What CPU actually does for a WordPress page load
When someone loads a WordPress page, the CPU:
- Receives the HTTP request via the web server (Nginx/Apache).
- Starts a PHP process to run WordPress core, your theme and plugins.
- Executes database queries to fetch posts, products, user sessions and options.
- Runs any custom logic: WooCommerce calculations, membership checks, discount rules, etc.
- Builds the final HTML and sends it back to the browser.
If page caching is working, most of that PHP and SQL work is skipped and CPU use per request is much lower.
Common CPU metrics: % usage, load average, per core limits
Hosting panels often show:
- CPU %: How much of your assigned CPU capacity is in use. On shared hosting this is usually a slice of a multi core server. On a VDS/VPS you might have 2 vCPUs or 4 vCPUs dedicated to you.
- Load average: A measure of how many processes are waiting for CPU or I/O over 1, 5 and 15 minutes. Rough rules:
- On a 2-core system, load of 2 means fully busy but not necessarily stuck.
- Load consistently higher than your core count (for example 6 on a 2-core system) often means the server is queuing work.
- Per core limits: Some shared platforms give you “100% of 1 core” or “200% of 1 core”. Hitting 100% just means you are using your slice fully.
How CPU usage links to slow pages, 502/504s and timeouts
CPU issues tend to show up in one of these ways:
- Sluggish admin and slow page generation: CPU near its cap, high load averages, MySQL using a lot of CPU. Typical with complex WooCommerce or large query-heavy sites.
- Intermittent 502/504 errors: Spikes where CPU and processes hit a ceiling and new requests cannot get a worker in time.
- Queueing behaviour: Requests wait longer for a free PHP worker, so TTFB grows during peaks even if the rest of the page is fairly light.
The article on why server performance problems are rarely caused by one thing explains how CPU, I/O and application logic interact in these scenarios.
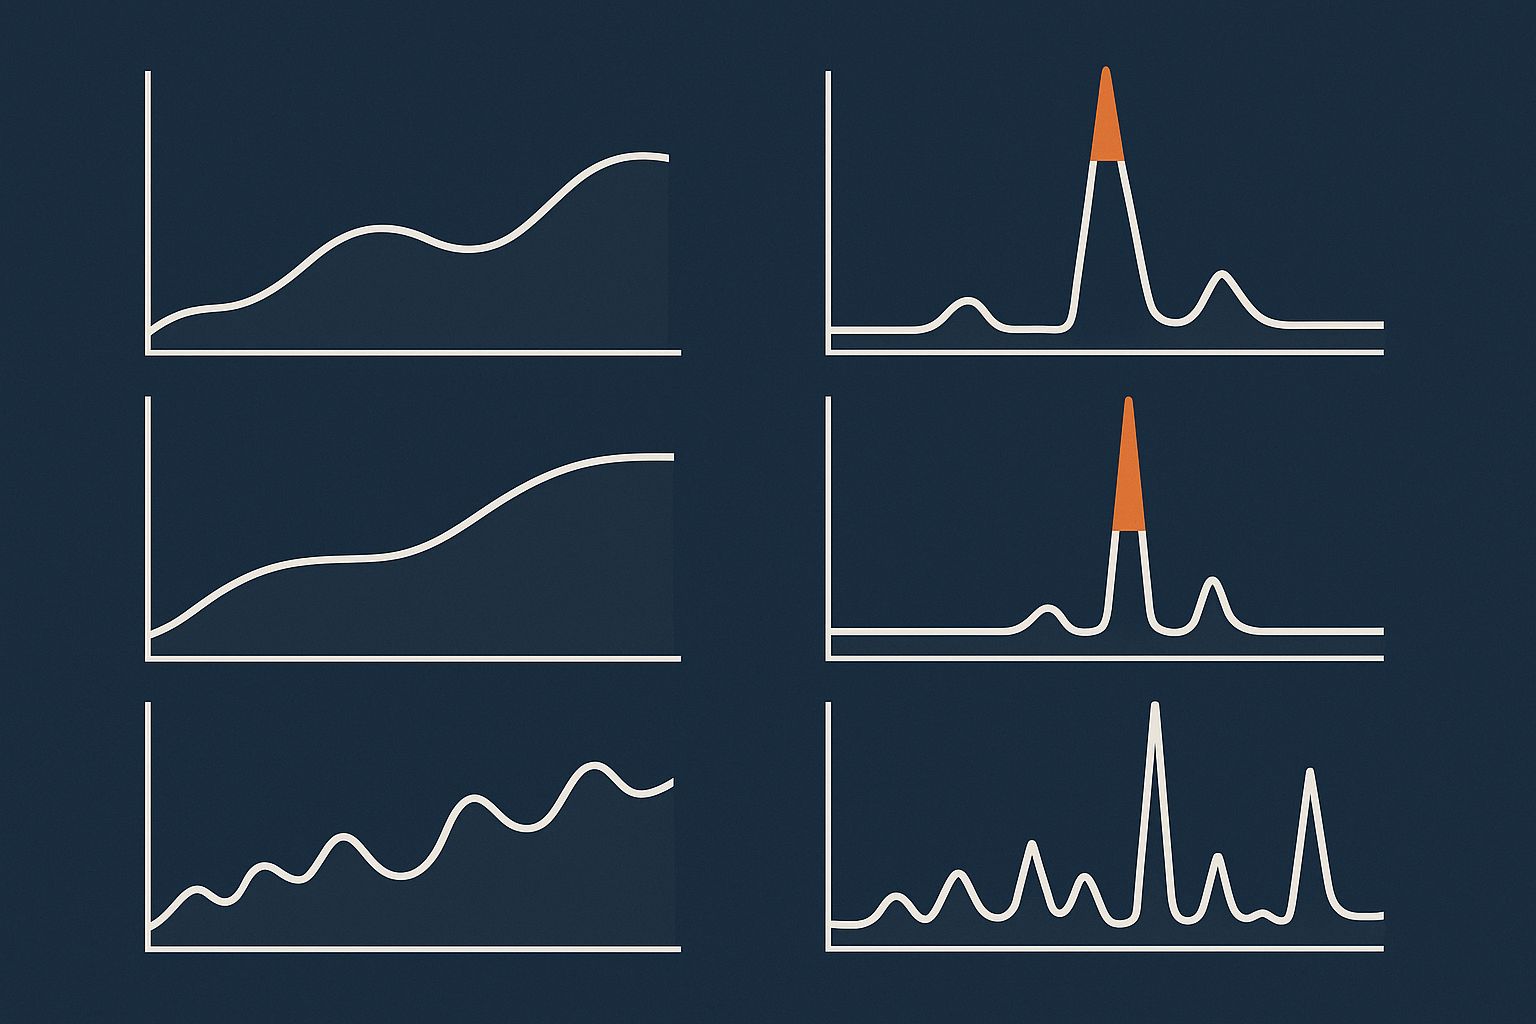
Healthy vs worrying CPU patterns for brochure sites and WooCommerce shops
Examples of healthy patterns:
- Brochure site: CPU mostly under 20% with occasional short peaks when publishing content, running backups or during small traffic bursts.
- WooCommerce shop: CPU under 40–60% on normal days, rising during busy periods but dropping again between peaks. Short lived spikes to 80–100% are not a concern if users do not see slowdowns.
Patterns that warrant investigation:
- CPU flat at or near 100% during normal traffic.
- Load average consistently higher than the number of cores for long periods.
- Spiky CPU exactly matching times users report checkouts hanging or 502s.
- High CPU but low legitimate traffic, often a sign of bots or a runaway task.
When high CPU is a real issue and when caching or bot filtering is the better fix
High CPU is not always a signal to upgrade. Ask:
- Is most traffic arriving as uncached requests (logged-in users, dynamic pages, bypassed cache)?
- Are search engines or scrapers hammering product pages or XML feeds?
- Is a specific plugin (for example search, reporting, security, page builders) generating expensive queries?
In many cases, putting robust page and object caching in front of PHP, tuning WooCommerce queries and cutting abusive bots can halve CPU usage without touching your plan. Services like the G7 Acceleration Network for caching and bot filtering handle caching at the edge and use bot protection to filter non human traffic before it hits PHP or the database, which keeps CPU use and response times more stable under load.
RAM usage: memory, PHP workers and why “full” is not always a problem
What RAM does on a WordPress server in simple terms
RAM is fast, short-term storage used while the server is working:
- PHP scripts and WordPress core live in RAM while running.
- MySQL uses RAM for buffers and query cache to avoid reading from disk.
- The operating system caches frequently-accessed files so they do not need to be read from disk every time.
Enough RAM lets your server keep hot data close. Too little RAM forces it to swap to disk, which is slow.
Used, free, cached and buffers: why Linux always looks “busy”
Linux systems try not to leave RAM idle. Free memory is turned into cache and buffers. This is why graphs sometimes show very little “free” RAM even on a healthy server.
- Used: Memory actively used by applications.
- Cached / buffers: File system cache and other temporary data the OS can drop if needed.
- Free: Completely unused memory.
If “used + cached” is high but the system is not swapping and performance is fine, it is usually healthy. Worry more about swap behaviour and application errors than “free RAM” alone.
How PHP memory limits relate (and do not relate) to server RAM
The memory_limit you set in php.ini or .htaccess is per PHP process, not per server. For example:
- Server has 4 GB RAM.
- PHP memory_limit is 256 MB.
- In theory, 16 PHP processes all using their full limit could attempt to consume 4 GB.
In reality, not every request uses the full limit, but this interaction matters. If you set the PHP memory limit very high on a small server, a burst of concurrent requests can exhaust RAM quickly.
Symptoms of true memory pressure: swapping, errors and crashes
Look for:
- Swap usage rising: The server is moving data from RAM to disk. Some swap use is acceptable, but growing, sustained swap with slow responses points to pressure.
- OOM (Out of Memory) kills: System logs show the kernel terminating MySQL, PHP-FPM or other processes.
- Random 500 errors: Especially under load, if processes die due to lack of memory.
- Admin extremely slow even when traffic is low: MySQL working from disk instead of RAM.
Practical RAM thresholds for small, medium and busy WordPress sites
Very rough guidelines:
- Small brochure site (few hundred visits per day): 1–2 GB RAM is often enough with good caching, as long as MySQL and backups are tuned.
- Medium WooCommerce or membership site: 4–8 GB RAM gives breathing room for PHP workers, MySQL and caching layers.
- Busy or complex shop (many plugins, heavy reporting, thousands of concurrent users): 8 GB+ RAM, often with separate database or a high performance VDS.
If your graphs show RAM often maxed out, with swap growing and errors, then more memory or better process limits are usually needed as well as some optimisation.
Disk I/O and storage: the silent bottleneck behind many “slow server” complaints
What disk I/O actually measures
Disk I/O measures how fast data is read from and written to storage. On a WordPress site this includes:
- Loading PHP files for WordPress core, themes and plugins.
- Reading and writing MySQL database files.
- Serving and storing uploads, images, logs and backups.
Read vs write operations in WordPress and WooCommerce
Common patterns:
- Reads: Loading pages, querying products, pulling cached data.
- Writes: Orders being placed, carts updated, users logging in, scheduled tasks, backups, imports and log files.
Busy WooCommerce sites often see spikes in writes when many orders are created, or when plugins run reports or synchronise with external systems.
How slow storage feels in real life: long TTFB, random freezes, stalled checkouts
Slow or saturated disk I/O often shows as:
- Long Time to First Byte, even when CPU and RAM look fine.
- Pages that “hang” halfway through loading then complete suddenly.
- WooCommerce checkout stalling on the payment step, then finishing.
- Slow wp-admin list views (orders, posts, products) when many queries hit large tables.
- Heavy backup or import jobs making the whole site sluggish.
On shared hosting, many customers compete for the same disks, so noisy neighbours running backups or imports can affect you even if your own usage is modest.
I/O limits on shared hosting and why they matter for backups, imports and cron
Shared platforms often have explicit I/O limits, such as “5 MB/s” or “10 MB/s” per account. When you hit this ceiling, further disk operations queue, which slows everything down.
Symptoms include:
- Backups stuck at certain percentages or taking hours.
- CSV imports or exports timing out or needing multiple attempts.
- Cron tasks overlapping because previous ones did not finish in time.
Running heavy operations such as full backups, imports and virus scans during off-peak times can reduce the impact. On a higher tier shared plan or a VDS you will usually have more consistent I/O.
How to spot I/O saturation patterns in graphs
Look for:
- Disk throughput flat at the plan’s maximum during problem periods.
- I/O wait in CPU graphs (often visible in tools like
top/htop) spiking when the site is slow. - Sharp steps in I/O usage matching scheduled tasks such as backups or imports.
If you see I/O maxed exactly when TTFB jumps and pages freeze, storage performance or contention is likely part of the problem.
Other useful metrics: processes, bandwidth and connections
Number of processes / PHP workers and concurrent users
Many platforms show the number of active processes or PHP workers. Key points:
- If workers approach their limit, new requests have to wait or are rejected.
- High worker counts with low traffic can indicate long-running scripts or slow database queries.
- WooCommerce sites with logged-in users and personalised content will naturally use more workers than static blogs.
Adjusting worker limits is a trade off. More workers can handle more concurrent users, but they also consume more RAM and can increase CPU pressure if the code is heavy.
Bandwidth and requests: traffic vs abusive bots
Bandwidth and request count graphs help you see what is actually hitting your server:
- Smooth increases in bandwidth and requests during campaigns are normal.
- Sudden bursts of requests without a matching marketing event can be bots.
- High request counts with low bandwidth often indicate bots fetching many small pages rapidly rather than real users.
A network layer such as the G7 Acceleration Network can sit in front of your origin and use bot protection to filter abusive crawlers and brute force traffic before it hits PHP or the database. This reduces wasted server load and helps keep response times consistent during spikes.
Latency and TTFB: how they tie back to CPU, RAM and I/O
Latency and TTFB (Time to First Byte) are what users feel directly. High TTFB can be caused by:
- CPU saturation or long PHP execution times.
- Disk I/O saturation or slow database reads.
- Network distance or congestion between user and server.
- External APIs holding up page generation (for example payment gateways, CRMs, marketing scripts).
When TTFB is slow but CPU and RAM are fine, look closely at disk I/O, database queries and external services.
Connecting resource graphs to real WordPress symptoms
If your site is slow but graphs look fine
If users complain about speed but CPU, RAM and I/O graphs are all low to moderate, the bottleneck is likely not raw resources.
Front end bloat and Core Web Vitals issues
Common causes include:
- Heavy images and media with no compression or modern formats.
- Too many JavaScript and CSS files from themes, builders and plugins.
- Render-blocking scripts that delay when content appears.
These problems show up in Core Web Vitals metrics (LCP, CLS, FID) and Lighthouse reports, not in server resource graphs. A content site with strong caching may show almost flat CPU graphs even if pages feel slow in the browser.
Using image optimisation helps a lot here. For instance, the G7 Acceleration Network can convert images to modern AVIF and WebP formats on the fly, typically cutting file sizes by over 60 percent with no plugin changes inside WordPress, which directly reduces page weight and improves on-site performance.
Slow external APIs and third party scripts
If a page waits on:
- Payment gateway checks.
- Marketing or analytics scripts.
- CRM or stock management APIs.
then the user sees slowness even if your own server is idle. These delays often appear in browser waterfall charts but not in CPU/RAM graphs. Where possible, load third party scripts asynchronously and move slow integrations off the critical path of page loads.
If peaks on the graph match slowdowns and errors
This is good news in a way: at least the problem is visible.
Busy periods, marketing campaigns and search crawlers
When graphs and slowness line up, ask:
- Did you send an email campaign or run ads at this exact time?
- Were you featured in the media or on a partner’s site?
- Has a search engine started crawling more aggressively?
Tools like analytics and access logs can help confirm. To prepare for predictable spikes, pair capacity planning with caching and traffic controls. The article on handling traffic spikes on WordPress without breaking the bank walks through practical preparations.
Bad plugins, runaway cron jobs and background tasks
Sometimes graphs spike because of internal tasks:
- A backup plugin doing full site backups every hour.
- A product sync running too often or with no batch limits.
- A reporting plugin recalculating data on every page load.
- Cron jobs that were meant to run daily but now run repeatedly due to errors.
Check your scheduled tasks (for example with WP Crontrol), backup schedules, and any automation or sync plugins. Moving heavy tasks to off-peak hours or external services can smooth your graphs considerably.
If graphs are flat but you still see 502/504s or drops
If your site shows 502/504 but CPU/RAM/I/O are low:
- Edge or proxy layer (Cloudflare, load balancer, WAF) may be timing out before requests reach your server.
- A misconfigured PHP-FPM or web server limit could be capping concurrent connections.
- The database might be locked or down while the web server idles.
- Network issues between edge and origin can cause intermittent errors without high local resource use.
Here, logs are more helpful than graphs. Collect web server and PHP error logs around the times of failure when asking your host for help.
Step by step: how to read your graphs during a slow period
Step 1: Note the exact time and type of symptom
Write down:
- Exact timestamps (including time zone).
- What users saw (slow pages, specific errors, checkout issues).
- What was happening (campaign, staff bulk import, scheduled email send).
Step 2: Check CPU, RAM and I/O for the same window
In your hosting panel:
- Set the graph window to cover at least 30 minutes before and after the problem time.
- Look for peaks or plateaus in CPU, RAM use and disk I/O.
- Note whether they start or end suddenly (backups, imports) or ramp more gradually (traffic growth).
Step 3: Compare with request counts and bandwidth
Next, open request or bandwidth graphs:
- If requests and bandwidth also spike, the load is likely real traffic.
- If requests spike but bandwidth does not, suspect bots hitting many small pages.
- If traffic graphs are flat but resources spike, suspect internal tasks such as backups or cron.
Step 4: Decide if this is a resource limit or an application problem
Ask yourself:
- Are you consistently hitting the top of your CPU/RAM/I/O limits during normal business?
- Or only during exceptional events such as imports, backups or big campaigns?
- Do optimisations (caching, image compression, removing heavy plugins) noticeably reduce peaks?
If normal days are fine and only rare events cause issues, better scheduling and optimisation may be enough. If graphs spend much of the day near their ceiling, it is time to think about more powerful hosting or isolated resources.
Step 5: Capture evidence for your hosting provider or developer
Before contacting support or a developer, gather:
- Screenshots of CPU, RAM, disk I/O and request graphs for the problem period.
- Specific timestamps and user reports.
- Notes on what you or your team were doing (publishing, importing, updating plugins, running sales).
This makes it easier for them to distinguish between capacity issues, misconfigurations and application bugs.
When you really need more resources vs when you need better optimisation
Situations where upgrading CPU/RAM is the right move
More resources usually help when:
- Graphs show CPU or RAM near their limits for long periods on regular days.
- High usage closely tracks legitimate, expected traffic growth.
- You have already:
- Implemented page and object caching where sensible.
- Optimised or replaced obviously heavy plugins.
- Reduced unnecessary background tasks.
- New features (for example personalised recommendations, complex search) are inherently CPU or memory intensive.
In these cases, moving from crowded shared hosting to virtual dedicated servers with dedicated CPU and RAM can remove the “noisy neighbour” effect and give you predictable performance.
When smarter caching, image optimisation and bot filtering have a bigger impact
Upgrading alone will not fix inefficiencies such as:
- No page caching for anonymous visitors.
- Huge unoptimised images on key landing pages.
- Bots hammering your site, wp-login or XML feeds.
- Multiple similar plugins duplicating work.
Here, focus on:
- Implementing solid caching rules and ensuring they are not bypassed unnecessarily.
- Compressing and resizing images and media properly.
- Blocking or throttling abusive bots and crawlers.
How the G7 Acceleration Network reduces CPU, I/O and bandwidth load
Using a network-level optimisation layer such as the G7 Acceleration Network for caching and bot filtering offloads work away from your origin. Static and cacheable responses are served from the edge, so PHP and MySQL are hit less often, which lowers CPU and disk I/O. At the same time, its bot protection filters abusive and non human traffic before it reaches your server, which cuts wasted bandwidth and keeps performance steadier during peaks.
On the media side, automatic conversion of images to AVIF and WebP at the edge significantly reduces page weight. This sort of on-the-fly optimisation, which G7Cloud includes free for each hosted site without extra plugins, typically shrinks image sizes by 60 percent or more while preserving real-world visual quality.
For WooCommerce: what “busy but healthy” should look like
For a well-optimised WooCommerce store on appropriate hosting, healthy patterns look like:
- CPU and I/O rising during sales and campaigns but falling back between them.
- RAM usage relatively stable with little or controlled swapping.
- TTFB slightly higher at peaks but still within acceptable ranges for most pages.
- No prolonged flat-lining of any metric at its maximum.
Short bursts of stress are acceptable. Sustained saturation is not.
Choosing the right hosting model when graphs are always maxed out

Shared hosting vs VDS / VPS vs dedicated: what actually changes in the graphs
Shared hosting:
- You share CPU, RAM and disk with many customers.
- Resource limits are often enforced per account.
- Graphs may show usage hitting fixed ceilings even if the physical server has spare capacity.
VDS / VPS:
- You have allocated vCPUs, RAM and disk that are isolated from other customers.
- Graphs reflect your actual share, not the whole machine.
- Saturation means you genuinely need more capacity or optimisation, not that a neighbour is noisy.
Dedicated server:
- You control all resources on that hardware.
- Graphs show the full picture for that server.
- Ideal for large WooCommerce or multi-site setups with predictable heavy load.
When to move from “noisy neighbour” shared plans to isolated resources
Consider moving to a VDS/VPS when:
- Your graphs show sudden, unexplained spikes that do not match your traffic.
- Performance varies wildly at different times of day despite stable visitor numbers.
- Your host confirms contention with other customers.
- You need more control over PHP versions, worker limits or database configuration than shared allows.
Why managed WordPress hosting helps if you are not a server engineer
If your team is busy running the business rather than tuning servers, a provider specialising in managed WordPress hosting plans can handle the lower-level pieces:
- Server and PHP configuration, security updates and backups.
- Baseline caching rules, HTTP/2 or HTTP/3 support and SSL management.
- Monitoring and first-level diagnosis when graphs show stress.
This leaves you focused on content, products and marketing while still benefiting from sensible defaults and proactive advice when usage trends change.
Practical next steps: a simple monitoring routine that fits in a busy month
A quick monthly checklist for watching resource trends
You do not need to stare at graphs daily. Once a month:
- Review CPU, RAM and disk I/O averaged over the month.
- Are peaks getting higher or lasting longer than before?
- Check bandwidth and request trends.
- Are there unexplained jumps that do not match marketing activity?
- Note any new plugins or features added in that period.
- Record a quick summary in a shared document so trends are easy to spot over 3–6 months.
What to send your host when you ask “is the server struggling?”
When contacting support, include:
- Specific dates and times when you saw issues.
- Screenshots or exported graphs for CPU, RAM, disk I/O and requests for those periods.
- Any error messages (502/504, database errors, PHP errors).
- A note on what changed recently (plugin updates, campaigns, imports).
This gives your host enough context to see whether the problem is capacity, configuration or something in your application code.
When to involve a developer or performance specialist
Consider bringing in a developer or performance specialist when:
- Graphs look fine but your site remains slow.
- Optimisations at the hosting layer do not move the needle.
- You suspect specific plugins or custom code are heavy but need profiling to confirm.
- You are planning a major redesign or feature launch that will change how pages are generated.
A good specialist will use tools like query monitors, profiling and lighthouse audits alongside your hosting graphs to identify bottlenecks.
Summary: turning confusing graphs into clear decisions
Resource graphs are not just technical noise. Once you understand what CPU, RAM, disk I/O, processes and bandwidth really represent, they become a practical tool for making decisions about your WordPress or WooCommerce site.
- Match slow periods on your site with graph peaks to see if the server is truly struggling.
- Distinguish between issues that need more capacity and those that need smarter caching, media optimisation or code changes.
- Use patterns over time, not single spikes, to guide whether you should upgrade hosting.
- Combine graphs with user reports, logs and front-end audits for a full picture.
If your graphs are frequently maxed out or you are tired of troubleshooting performance alone, it may be time to look at WooCommerce hosting with predictable performance or broader managed WordPress hosting plans that include network-level optimisation like the G7 Acceleration Network. Even if you stay where you are, the steps in this guide should help you have clearer, more productive conversations with any hosting provider or developer you work with.