
Why Logging and Error Monitoring Matter for WordPress and WooCommerce
From “the site is broken” to a clear root cause
Most WordPress and WooCommerce problems start with a vague report:
- “The checkout is not working.”
- “The site is really slow today.”
- “I saw a white screen and then it fixed itself.”
Without logs, you are guessing. You disable plugins one by one, try changing themes and hope the problem disappears before the next sale is lost.
Logging changes that. A useful log entry tells you exactly what happened at a specific time, on a specific request, often with a file name, line number and error message. That lets you move from “the site is broken” to “this plugin caused a fatal error when someone used Apple Pay at 10:03 this morning”.
Good managed WordPress hosting will already capture many of these details at the server level, while WordPress and WooCommerce add application level context. Your goal is not to collect every possible log, but to have enough information, in the right place, to answer “why did this go wrong?” without guesswork.
Real problems good logging helps you solve
Random 500 errors and white screens
HTTP 500 errors and “white screen of death” symptoms usually mean a PHP fatal error. Without logs, you see only the end result. With logging, you see entries like:
[03-Dec-2025 10:03:12 UTC] PHP Fatal error: Uncaught Error: Call to undefined function wc_get_order() in /home/site/public/wp-content/plugins/my-gateway/plugin.php:123
That single line tells you:
- Exactly when it happened.
- Which plugin is involved.
- Which file and line to examine or send to a developer.
It is common for white screens to appear only in certain conditions, such as logged in users or specific products. Having a timestamp and error log removes the need to reproduce the issue perfectly before you can start fixing it.
Intermittent WooCommerce checkout failures
Payment failures can be hard to trust, especially if customers do not always report them. WooCommerce logs can reveal patterns such as:
- PayPal or Stripe API timeouts at busy times.
- Misconfigured webhooks that never confirm payments.
- Customer data being rejected by the gateway due to format or country rules.
WooCommerce’s own log viewer shows gateway specific error messages and responses. Matching these to order numbers and customer reports lets you distinguish between “one person entered the wrong CVC” and “20 percent of Apple Pay attempts are failing between 8 and 9 pm”.
Slow admin, cron jobs and background tasks
WordPress relies heavily on cron jobs and background processes for tasks like:
- Publishing scheduled posts.
- Processing WooCommerce subscriptions and renewals.
- Sending transactional emails.
- Running backups or synchronising stock with external systems.
If these tasks start failing or queue up, the symptom might be a slow wp-admin area or orders not updating. Logs can show:
- Scheduled actions that keep failing with PHP errors.
- Tasks that take far longer than they should.
- Database queries that time out under heavy load.
Combining cron logs, WooCommerce’s Scheduled Actions list and PHP error logs is often the quickest way to diagnose “mysterious” admin slowness.
How logging fits with monitoring, backups and uptime checks
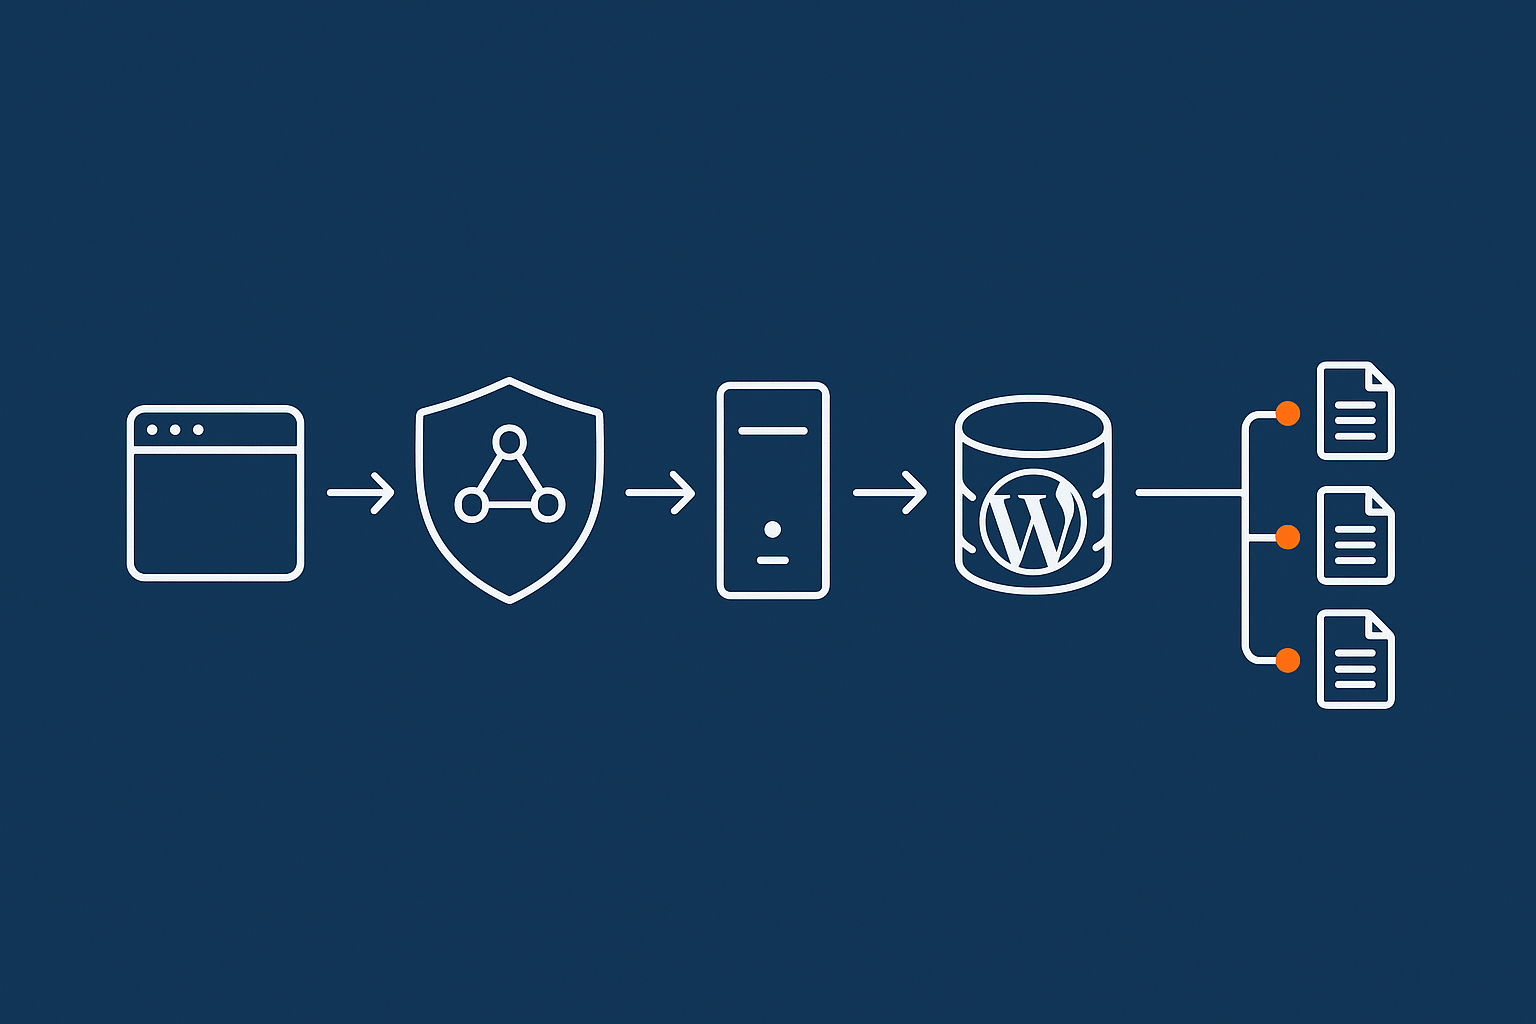
Logging is one piece of a broader reliability picture:
- Logging records what happened, usually on the server itself.
- Monitoring watches for problems in real time and alerts you.
- Backups let you recover from problems, not diagnose them.
- Uptime checks tell you when the site is unavailable but not why.
For example, an uptime monitor might alert you to repeated 502 / 504 errors. Logs then tell you whether it was a PHP crash, a database issue or a flood of traffic. If you want a deeper look at uptime itself, the guide Why Uptime Matters and How to Monitor Your WordPress Site Properly is a useful companion.
Managed WordPress hosting with G7Cloud typically includes server level logging, uptime monitoring and sensible backups out of the box, so you can focus on application level logging and business decisions rather than infrastructure.
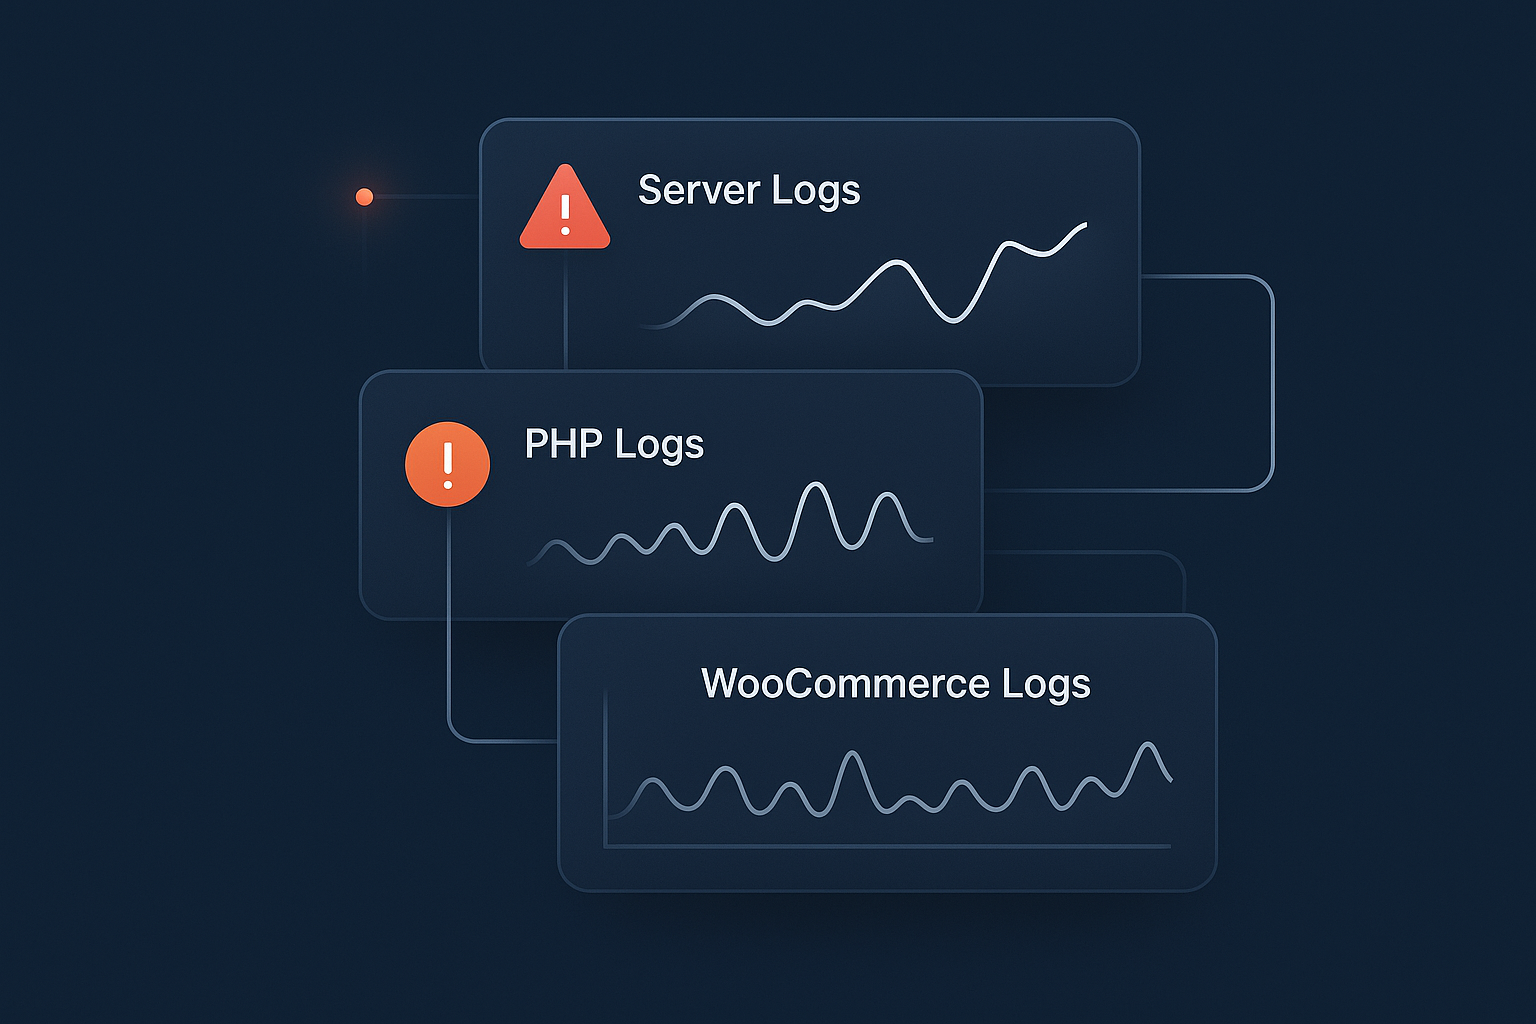
Key Types of Logs for WordPress and WooCommerce Sites
Application-level logs: WordPress and WooCommerce
Application logs sit closest to your code and business logic. In WordPress this usually means:
debug.logcreated byWP_DEBUG_LOG.- WooCommerce logs stored under
wp-content/uploads/wc-logs/. - Logs created by specific plugins, such as security or caching plugins.
These logs are ideal for:
- Seeing deprecation notices and compatibility warnings after updates.
- Tracking WooCommerce payment, shipping and webhook problems.
- Debugging custom code in themes and plugins.
Because they are application aware, they can include order IDs, user IDs, checkout context and more, which generic PHP logs do not know about.
PHP error logs: fatal errors, warnings and notices
PHP error logs sit just below WordPress. They record:
- Fatal errors that crash the request.
- Warnings and notices that do not stop execution but may indicate bugs.
- Parse errors when invalid PHP code is deployed.
On managed hosting, PHP error logs are usually accessible from the control panel or via SSH/SFTP, often one per site. On many platforms you can adjust the error level, but on production sites it is usually best to log everything and control visibility rather than suppressing messages entirely.
Web server logs: access and error logs
Web server logs cover the HTTP layer, typically Apache or Nginx:
- Access logs record every request, status code, URL, client IP and user agent.
- Error logs record server level issues such as 502/504 errors, configuration problems and upstream timeouts.
These are essential for:
- Spotting brute force attempts and aggressive crawlers.
- Correlating traffic spikes with slowdowns or failures.
- Debugging redirects, 404s and SSL/HTTP2 related problems.
On infrastructure that uses an edge layer such as the G7 Acceleration Network, part of the access logging happens before the request reaches the origin server. That can be very useful for distinguishing genuine customer requests from abusive traffic and bots.
Server and service logs on managed hosting
Database, Redis and system logs
Beyond PHP and the web server, there are logs for services such as:
- MySQL / MariaDB (database queries, slow query logs, restarts).
- Redis or other object caches.
- System services like cron, mail transfer agents and security daemons.
These logs are often the key to explaining intermittent issues that are not tied to a specific page, such as:
- Database restarts causing brief outages or dropped connections.
- Redis outages leading to unexpected cache misses and slow responses.
- Server resource limits being reached.
How much of this you should expect your host to handle
On quality managed WordPress hosting, you should expect your provider to:
- Monitor system and service logs for underlying platform problems.
- Handle log rotation and retention so files do not grow forever.
- Investigate server side anomalies when you provide timestamps and examples.
You are still responsible for:
- Application level logging and debugging (themes, plugins, custom code).
- Configuration of WooCommerce gateways and integrations.
- Ensuring sensitive data is not logged inappropriately.
The article Understanding Hosting Responsibility: What Your Provider Does and Does Not Cover is worth reading if you want more clarity on this split.
How WordPress Error Logging Actually Works
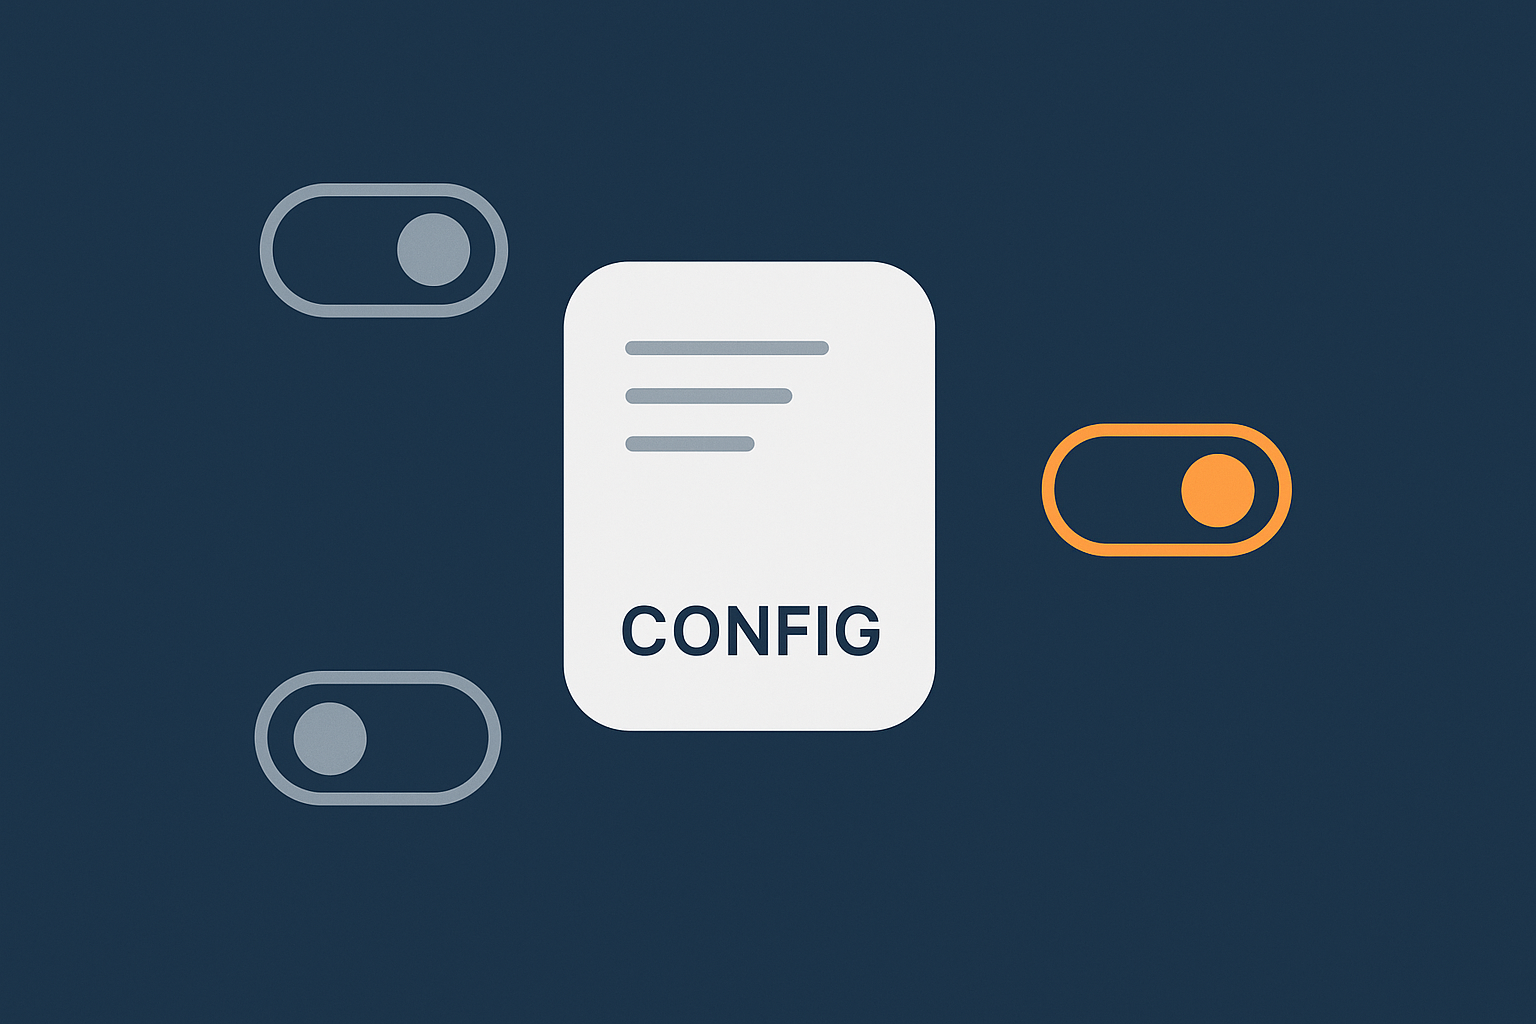
The core settings: WP_DEBUG, WP_DEBUG_LOG and WP_DEBUG_DISPLAY
WordPress error logging is controlled mainly by three constants in wp-config.php:
WP_DEBUGturns WordPress debugging on or off.WP_DEBUG_LOGwrites errors to a log file (usuallywp-content/debug.log).WP_DEBUG_DISPLAYcontrols whether errors are shown in the browser.
In simplified form:
define( 'WP_DEBUG', true );          // Enable debugging mode
define( 'WP_DEBUG_LOG', true );      // Log to wp-content/debug.log
define( 'WP_DEBUG_DISPLAY', false ); // Do not show errors on screen
On development or staging environments you might enable both logging and display. On production you almost always want logging enabled and display disabled.
Enabling logging safely without exposing errors to visitors
Recommended wp-config.php settings for production
A sensible production configuration looks like this:
define( 'WP_DEBUG', true );
define( 'WP_DEBUG_LOG', true );
define( 'WP_DEBUG_DISPLAY', false );
@ini_set( 'display_errors', 0 );

// Optional: limit log file size via server tools rather than here
This setup:
- Captures errors and notices into a log file.
- Hides error messages from visitors, avoiding information leaks.
- Still lets developers and support staff see what is happening under the hood.
If you are on managed hosting, it is worth confirming whether WP_DEBUG is already set at an environment level. Some providers override it or offer panel switches to control it.
Where the debug.log file lives and how to read it
By default, WP_DEBUG_LOG writes to wp-content/debug.log. On some platforms, it may be placed elsewhere for security. You can set a custom path:
define( 'WP_DEBUG_LOG', '/home/site/logs/wp-debug.log' );
To read the log:
- Use SFTP to download the file and open it in a text editor.
- Use SSH and run
tail -f wp-content/debug.logwhile reproducing the problem. - Use a log viewer tool if your hosting control panel provides one.
Look for entries around the exact time you experienced the problem. This is why capturing timestamps when issues occur is so important.
WooCommerce-specific logging and status tools
WooCommerce includes its own logging system and status pages:
- Logs under
WooCommerce → Status → Logswhere you can select log files by date and name, such asfatal-errors-2025-12-03.logor gateway specific logs. - System status under
WooCommerce → Statussummarising versions, active plugins, templates and environment details. - Scheduled Actions under
WooCommerce → Status → Scheduled Actionslisting background tasks, their status and run times.
Payment gateways often write their own log entries via this system. When debugging failed payments, checking the relevant gateway log for the same timestamp usually gives a much clearer answer than generic error messages shown to customers.
Practical Logging Setups for Common Hosting Situations
On quality managed WordPress hosting
What your host should already be logging for you
On specialist WooCommerce hosting with G7Cloud or similar providers, you should expect:
- PHP error logs, split per site or per container.
- Web server access and error logs.
- Database and system service logs at the infrastructure level.
- Automated log rotation and safe retention defaults.
This means you mostly need to configure application level logging (WordPress and WooCommerce) and know how to pass useful information to support teams when you need help.
How to work with support using timestamps and request IDs
Support teams can work far more quickly if you provide:
- The exact URL used.
- The exact time and time zone.
- Any visible error messages or HTTP status codes.
- Order IDs or user emails if appropriate.
Some platforms and edge networks add request IDs to response headers or error pages. If your managed host uses something like the G7 Acceleration Network, that ID lets them find the exact request across multiple layers of logs.
On shared or cPanel hosting
Finding PHP error logs and web server logs in cPanel
On cPanel based hosting you will usually find logs via:
- The “Errors” section, which shows recent Apache errors.
- The “Raw Access” section, where you can download access logs.
- Log files under directories like
logs/ortmp/at the account root.
PHP error logs are sometimes combined with Apache logs, sometimes written to error_log files in document roots or even per directory. If unsure, trigger a known warning (for example by visiting a non existent PHP file) and then search for recent log entries by timestamp.
Avoiding noisy logs that fill up disk space
Shared hosting often has strict disk quotas. Noisy logs can quickly consume your allowance and take the site offline.
Practical steps:
- Do not leave
WP_DEBUG_LOGenabled with very chatty plugins on live sites for long periods. - Fix recurring warnings rather than ignoring them.
- Download old logs and delete them periodically, or use cPanel tools to archive and rotate them.
If you find debug.log growing to hundreds of megabytes, you either have an underlying problem that needs fixing, or you are logging too much detail on a busy site.
On VPS / VDS and dedicated servers
Where Linux system and service logs usually live
On your own Linux server you have full access to all logs, usually under /var/log/, for example:
/var/log/nginx/or/var/log/apache2/for web server access and error logs./var/log/mysql/or/var/log/mariadb/for database logs./var/log/syslogor/var/log/messagesfor general system events.
Modern systems may also use journalctl (systemd journal) instead of plain text files. If you want a deeper primer, see Understanding System Logs on Linux and Where to Find Them.
Basic log rotation and retention hygiene
For self managed servers you are responsible for keeping logs under control. Typical steps:
- Use
logrotateto rotate logs daily or weekly. - Compress older logs to save space.
- Delete or archive logs older than your required retention period (often 30–90 days).
Check configuration in /etc/logrotate.d/ to ensure your access and error logs are rotating properly. Without this, a single busy WooCommerce site can grow gigabytes of logs in peak season.
A Simple Workflow for Debugging WordPress Problems Using Logs
Step 1: Capture the exact time, URL and action
When someone reports an issue, ask for:
- The URL they used.
- The exact time (including time zone).
- What they were trying to do (e.g. “clicked Place Order”).
- Any error message and a screenshot if possible.
Reproducing the issue while logging is enabled
Before you start, ensure logging is active:
- Enable
WP_DEBUG_LOGinwp-config.php. - Confirm WooCommerce logging is turned on for relevant gateways.
- Note where your PHP and web server logs are.
Try to reproduce the issue yourself, ideally in a separate browser or incognito window. Keep an eye on the relevant log files while you do so.
Step 2: Check WordPress and WooCommerce logs first
Start with the most specific logs:
wp-content/debug.logfor WordPress errors and notices.- WooCommerce logs around the same timestamp.
- Plugin specific logs if the issue is tied to a known plugin.
Look for:
- Fatal errors or uncaught exceptions.
- Repeated warnings on every request.
- Gateway error messages from payment providers.
Step 3: Look at PHP and web server logs for matching entries
If application logs are inconclusive or empty, move down a layer:
- Search PHP error logs for the same timestamp.
- Check web server error logs for upstream timeouts (often visible as 502/504).
- Review access logs to confirm what type of request and status code occurred.
For recurring gateway errors or 502/504 issues under load, the article Diagnosing and Fixing WordPress 502/504 Gateway Errors on Busy Sites demonstrates how to combine these logs with performance data.
Step 4: Decide whether it is a code, plugin, hosting or capacity issue
Once you have matching log entries, categorise the issue:
- Application/code issue: stack traces pointing to a theme or plugin file, deprecation notices after updates, missing functions.
- Integration issue: payment gateway API errors, webhook failures, third party API timeouts.
- Hosting/platform issue: database restarts, repeated 502/504 errors not tied to a specific plugin, file system errors.
- Capacity issue: slow queries under load, memory exhausted errors, errors only during peak traffic.
Linking log messages with CPU, memory and traffic spikes
For performance and capacity issues, link logs with resource usage:
- Check your hosting panel graphs for CPU, RAM and disk I/O around the problem time.
- Use tools like
toporhtopon VPS / dedicated servers. - Review access logs for spikes in concurrent requests or abusive crawlers.
If you run your own server, the guide How to Check CPU, Memory and Disk Usage on a Linux Server can help you interpret those figures alongside your logs.
Step 5: Escalate effectively to your hosting provider or developer
When you need help from your host or a developer, share:
- A clear description of the problem and how to reproduce it.
- Timestamps, URLs and any request IDs available.
- Relevant log snippets with paths and line numbers.
- Any patterns you have noticed (e.g. “only happens on mobile Safari”).
This saves everyone time and often avoids multiple back and forth emails. On managed platforms, support teams can then drill into deeper logs and metrics that you cannot see directly.
Error Monitoring vs Just Logging: When You Need Alerts and Dashboards
The limits of “check the logs when something breaks”
Manual log checking works for occasional problems. It does not scale when:
- You have a busy WooCommerce store where every hour of downtime costs money.
- You rely on multiple integrations (ERPs, fulfilment, accounting) that can fail silently.
- You are not watching the site when problems begin, such as overnight or weekends.
Error monitoring tools build on logs by:
- Aggregating errors into trends and rates.
- De-duplicating repeating issues.
- Alerting you by email, SMS or chat when thresholds are exceeded.
Lightweight options for SMEs: uptime checks, basic error alerts and dashboards
For most SMEs, you do not need a complex observability stack. A sensible setup could include:
- External uptime monitoring with response time tracking.
- A basic error monitoring service connected to your site, capturing PHP errors and front end JavaScript errors.
- Simple dashboards showing checkout success rates and payment gateway error counts.
Some managed hosting platforms offer integrated dashboards and alerts, reducing the need to bolt on separate tools. This can be enough to know when things go wrong without constantly staring at logs.
What to monitor on WooCommerce in particular
Checkout failures and payment gateway errors
For WooCommerce, consider tracking:
- The ratio of failed to successful checkouts.
- Error counts per gateway (e.g. Stripe, PayPal, Klarna).
- Abandoned checkouts where a gateway error was logged.
An unexplained rise in gateway errors is a strong signal that something changed, even if customers are not yet complaining.
Cron jobs and scheduled actions
Monitor WooCommerce Scheduled Actions for:
- Jobs stuck in “pending” or “failed” states.
- Unusual run times for critical tasks like subscription renewals.
- Backlogs that grow during busy periods and never fully clear.
Many performance and email problems ultimately come back to scheduled tasks not running properly. Regularly reviewing these and setting alerts for failures can catch issues days before they turn into support tickets.
Performance, Bad Bots and Log Noise: Keeping Things Under Control
Why too many log entries can become a problem
Disk usage and log file growth
Logging everything at maximum detail can:
- Fill disk space, especially on shared hosting or small VPS plans.
- Slow down log reading and search tools.
- Make it harder to rotate and archive logs effectively.
Focus logging on useful information. For example, log warnings and errors in production, and reserve very verbose debug output for staging or limited time windows.
Separating real errors from harmless notices
Not all log entries are equally serious:
- Fatal errors break pages and must be fixed.
- Warnings may indicate poor configuration or upcoming breakage.
- Notices are often harmless but can point to future compatibility issues.
If your logs are full of notices from a single plugin, you might suppress that level for production or ask the developer to clean them up, rather than letting them drown out real problems.
How abusive bots create both load and noisy logs
Bad bots and scrapers can:
- Generate huge volumes of requests that clutter access logs.
- Hammer login pages and XML-RPC, generating authentication failures.
- Crawl expensive pages repeatedly, increasing server load.
This not only impacts performance but also makes it harder to see real customer activity in your logs. Login abuse and cart crawling can flood error logs with spurious messages unrelated to genuine users.
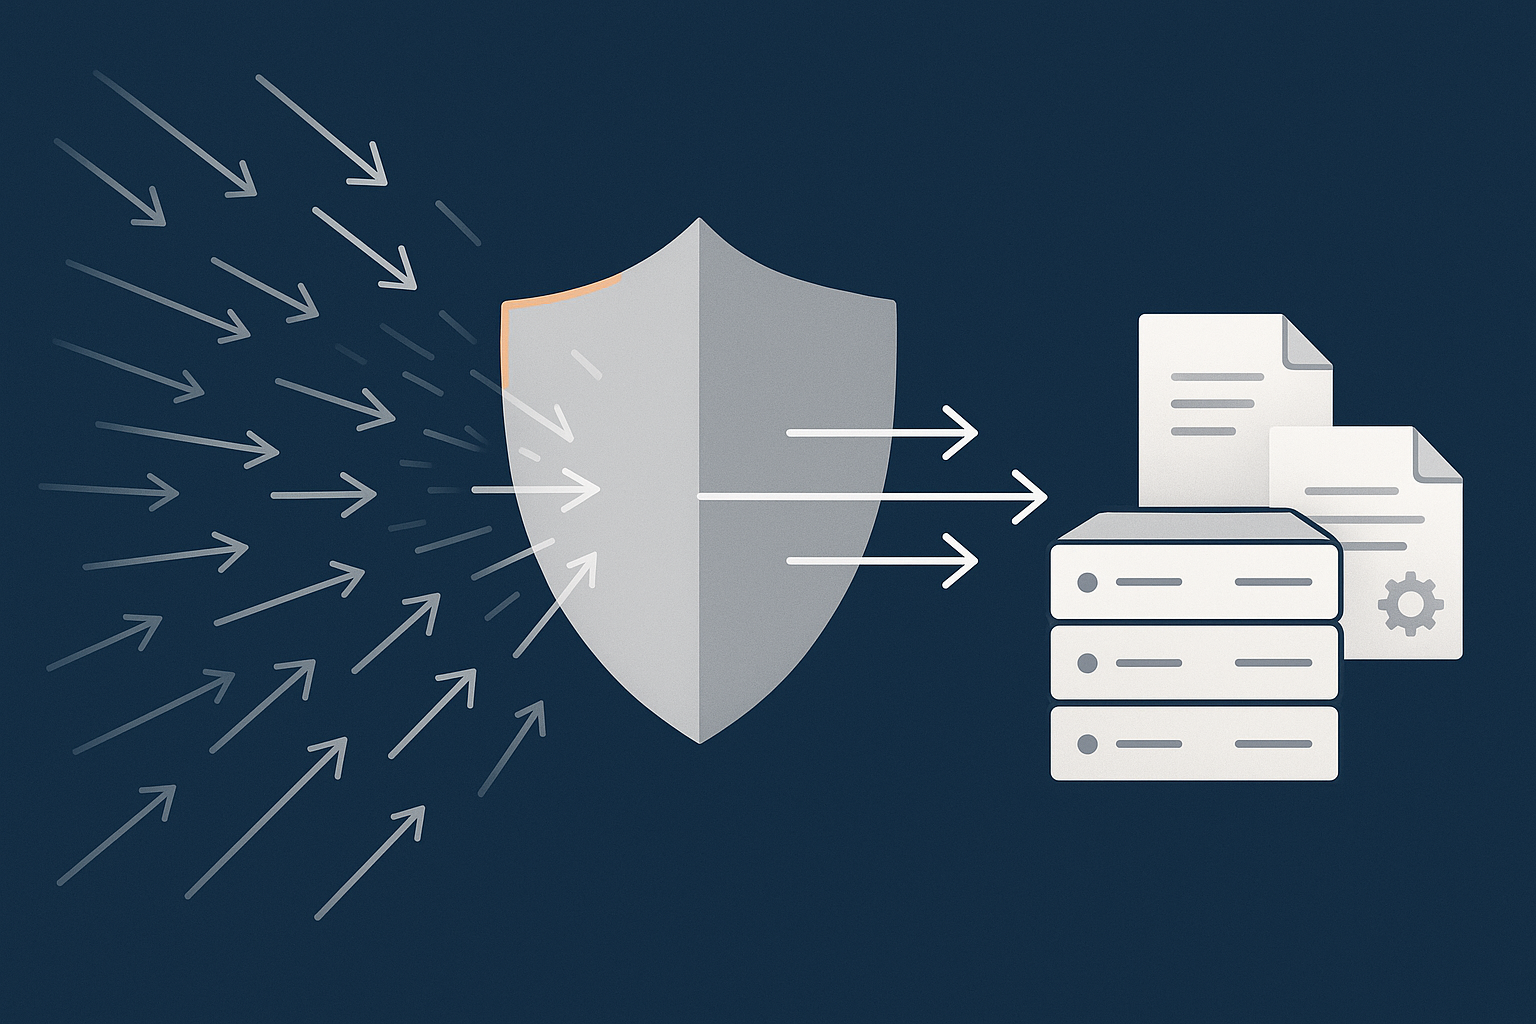
Using managed protection to filter bad traffic before it hits PHP
How the G7 Acceleration Network reduces pointless log noise and server load
A managed edge layer such as the G7 Acceleration Network can filter abusive and non human traffic before it reaches PHP or the database. By blocking or challenging known bad bots and suspicious patterns at the edge, it reduces wasted server load, keeps response times steadier and prevents your application and PHP logs from filling with noise from pointless requests.
For security more broadly, a host that offers strong web hosting security features can help you strike the right balance between logging legitimate security events and not drowning in authentication noise.
Security, Compliance and Error Logging
What should never appear in your logs
Passwords, full card numbers and other sensitive data
Logs are often stored unencrypted, copied to multiple locations and viewed by multiple people. Certain data should never appear in them:
- User passwords, password reset tokens or secret keys.
- Full payment card numbers, CVV codes or full bank account numbers.
- Raw authentication headers or complete OAuth tokens.
Payment gateways used with WooCommerce typically handle card data on their own systems specifically so it never touches your server. If you see card numbers in your logs, something is seriously misconfigured.
PII in WooCommerce order and customer logs
Personally identifiable information (PII) such as names, email addresses, phone numbers and addresses often appears in logs indirectly, for example as part of an error message from an external API.
To minimise risk:
- Avoid logging full payloads of requests and responses in production.
- Mask or hash identifying fields where possible (e.g.
user_idinstead of email). - Use order IDs rather than full names when writing custom log entries.
PCI-conscious stores and audit-friendly logging habits
If you handle payments, even via third parties, adopting PCI conscious habits is sensible:
- Document where logs are stored and who has access.
- Define how long logs are retained and how they are disposed of.
- Ensure production logs do not contain sensitive financial data.
- Restrict log access to authorised staff and trusted providers.
Auditors often appreciate clear, consistent logging that shows when changes were made and when errors occurred, as long as it does not expose confidential data.
How hosting responsibilities and your responsibilities line up
Your hosting provider is usually responsible for:
- Securing the underlying infrastructure and system level logs.
- Restricting access to platform logs to authorised personnel.
- Providing secure channels for sharing log details in support cases.
You are typically responsible for:
- Application level logging in WordPress and WooCommerce.
- Ensuring custom code does not log sensitive information.
- Managing who on your team can access logs and backups.
Clarifying this division with your provider reduces surprises and helps you design a logging approach that respects both practical debugging needs and compliance requirements.
Building a Sensible Logging and Monitoring Checklist for Your Site
Baseline setup for most WordPress business sites
For a non ecommerce business site, a reasonable baseline looks like:
WP_DEBUG_LOGenabled,WP_DEBUG_DISPLAYdisabled on production.- PHP and web server logs available and rotating properly.
- External uptime monitoring with email alerts.
- Periodic review of logs for recurring warnings and notices.
If your site relies heavily on media, remember that large images can also create performance issues that show up indirectly in logs as timeouts and slow queries. On platforms that use the G7 Acceleration Network, images are automatically converted to AVIF and WebP on the fly, which typically reduces file sizes by more than 60 percent without needing extra plugins or changes inside WordPress.
Additional checks for busy WooCommerce stores
For active shops, add:
- WooCommerce logging enabled for all payment and shipping gateways.
- Regular checks of the Fatal Errors log in WooCommerce.
- Monitoring of Scheduled Actions for stuck or failing tasks.
- Basic error rate monitoring for checkout pages.
- Protection against abusive bots that might skew traffic and logs.
A managed platform with built in bot protection, such as G7Cloud’s filtering within the G7 Acceleration Network, can reduce abusive crawler and brute force traffic before it ever reaches PHP or MySQL. This keeps your logs cleaner, server load smoother and protects uptime during promotions and seasonal peaks.
When to consider upgrading hosting or moving to managed WordPress hosting
It may be time to move to managed WordPress hosting if:
- You regularly hit resource limits and see capacity related errors in logs.
- You spend more time firefighting slowdowns and outages than improving the site.
- You struggle to access or understand server level logs on your current host.
- You need more robust protections against bad traffic and attacks.
In those situations, having a provider that understands WordPress and WooCommerce logs, and can interpret them with you, saves considerable time and stress.
Next Steps
Questions to ask your current or future hosting provider
When evaluating hosts, ask specific questions about logging and monitoring:
- Which logs are available to me directly, and how do I access them?
- How long are logs retained, and how is log rotation handled?
- Do you provide any dashboards or alerts for errors and uptime?
- How does your platform handle abusive bots and noisy traffic before it reaches WordPress?
- If I report an issue with timestamps and examples, what can your team see and investigate beyond what I can see?
How managed hosting and proper logging reduce firefighting long term
Good logging and monitoring will not prevent every problem, but they dramatically reduce the time between “something is wrong” and “we know exactly what to fix”. Combined with capable managed WordPress hosting, this moves you from reactive firefighting to calm, predictable maintenance.
If you are spending too much time chasing vague errors or struggling with limited logs on basic hosting, it is worth exploring whether managed WordPress hosting with G7Cloud and the G7 Acceleration Network can handle more of the low level detail for you. That leaves you free to focus on your content, customers and growth, knowing that when something does go wrong, you have the information and support needed to resolve it quickly.