Why Uptime Matters and How to Monitor Your WordPress Site Properly
Why uptime matters more than most people think

What “uptime” actually means in plain English
Uptime is simply the amount of time your website is available and working as visitors expect.
When people talk about “99.9% uptime”, they are saying that during a given period (usually a month or a year) your site is reachable, responds successfully and serves content correctly for 99.9% of that time.
However, for a WordPress or WooCommerce site, visitors do not care about percentages or technical definitions. They care about:
- Whether the site loads quickly when they click a link.
- Whether they can add items to the basket and check out.
- Whether they can submit a contact form or log in.
If any of those journeys fail, it is downtime in practical terms, even if the server itself is technically still “up”.
The real world impact of downtime for WordPress and WooCommerce
Lost sales and leads
For brochure sites, downtime means missed enquiries. For WooCommerce shops and membership sites, it means direct loss of revenue.
Consider a simple example:
- Your site averages 200 visits per day.
- Average order value is £60.
- Conversion rate is 2%.
If you have a two hour outage during a busy weekday afternoon, you might miss 16–20 visitors who would have converted. That is easily £200+ in lost sales from a single incident, not counting repeat custom that never starts.
Even for lead generation sites, an outage during a campaign can waste paid advertising spend and lose opportunities you cannot easily get back.
Brand trust and support headaches
Every time someone sees an error page, a spinning loader or a broken checkout, confidence drops. If they are returning customers, they may contact your support team, which creates extra workload just to handle avoidable problems.
Typical side effects of recurring downtime include:
- More “Is your site down?” emails and calls.
- Refunds or discounts offered after failed orders.
- Staff wasting time testing the site manually.
For small teams, this is especially draining. Good uptime monitoring lets you know about issues before customers do, so you can respond calmly instead of firefighting.
SEO and Core Web Vitals signals
Search engines try not to send users to sites that are often unavailable or very slow. While short, rare outages are usually tolerated, repeated downtime and long periods of poor performance can contribute to weaker rankings over time.
Google has said that it treats brief outages differently from long-term unavailability, but if crawlers frequently hit errors or timeouts, they may crawl less often and trust your site less. Slow pages and unstable performance also make it harder to keep Core Web Vitals in a good range.
Image and asset weight affect these performance signals too. If you are working on Core Web Vitals, it helps when your infrastructure supports modern formats. For example, the G7 Acceleration Network can automatically convert your WordPress images to AVIF and WebP on the fly, often cutting image sizes by more than 60 percent without plugins or code changes, which directly reduces load times and improves stability.
Why “99.9% uptime” on a sales page is not the full story
Many hosting plans advertise “99.9% uptime” or better. That sounds excellent until you translate it into real minutes and think about exactly what is being measured.
Translating percentages into real minutes and hours
Here is roughly what common uptime percentages mean over a month (30 days):
- 99% uptime ≈ 7 hours 18 minutes of downtime.
- 99.9% uptime ≈ 43 minutes of downtime.
- 99.99% uptime ≈ 4 minutes 19 seconds of downtime.
Even at 99.9%, you could have one outage of 30–40 minutes during your peak time. For a busy WooCommerce store or high value B2B site, that can be painful. It also assumes downtime is in one block, which is rarely the case. Multiple small outages can be just as disruptive.
If you want to go deeper on how guarantees are calculated and what they cover, there is a more detailed explanation in What Uptime Guarantees Really Mean in Real World Hosting.
Planned vs unplanned downtime
Most uptime guarantees exclude planned maintenance. If your host schedules a two hour maintenance window at night and your site is offline, that often does not count towards the uptime SLA.
Planned maintenance is not inherently bad. Systems do need patching and upgrades. The key is:
- How often it happens.
- How well it is communicated.
- Whether the maintenance windows are actually used or just held “in reserve”.
From your visitors’ perspective, it makes little difference whether downtime is planned or not if they hit a dead site. Your own monitoring needs to track all kinds of downtime, not just those counted in a marketing SLA.
Partial outages that uptime guarantees often ignore
SLAs usually measure whether the server responds at all. They do not usually measure whether:
- Checkout works.
- Login forms submit successfully.
- The site takes 40 seconds to load.
This is where real-world uptime monitoring is different. You care about the availability of user journeys, not only HTTP responses. A 200 OK status on a blank or broken page is technically “up”, but it is downtime for your business.
Different types of downtime that affect WordPress
Not all downtime looks the same. Understanding the different failure modes helps you choose the right monitoring and response.
Hard downtime: when your site is truly offline
Hard downtime is when visitors cannot reach your site at all. Browsers show errors like “Server not found” or “Connection timed out”.
DNS and domain issues
If your domain expires, or your DNS records are misconfigured, visitors will not even reach your hosting server. Typical causes include:
- Domain registration not renewed in time.
- Nameserver changes not applied correctly.
- A records pointing to the wrong IP.
Uptime monitoring from external services will catch this, but your own tests must check the right domain, not just the server IP.
Hosting or data centre failures
Sometimes the server itself is unreachable because of hardware failure, network issues upstream, or a serious incident in the data centre. If your hosting provider has a status page, you will usually see this reflected there.
In these cases, having a reliable hosting platform with good web hosting performance features and resilience makes a big difference. There is little you can do in WordPress itself while the server is unavailable.
Soft downtime: when the site is “up” but not usable
Soft downtime is often more common and more subtle. The server responds, but the site is slow, error prone or missing key functionality.
500 errors, PHP crashes and database issues
WordPress depends on PHP and MySQL or MariaDB. If PHP crashes, or the database is overloaded, visitors see 500 or 503 errors, or intermittent failures.
Causes include:
- A plugin update introducing a fatal error.
- Database connections hitting their limit under heavy load.
- Insufficient memory or CPU on the hosting plan.
Standard uptime checks may record this as up or down depending on timing. It is better to use HTTP checks that treat 5xx responses as failures.
Checkout, login or admin area failing while other pages work
On WooCommerce sites, payment gateways, session handling and cart fragments create extra moving parts. It is common for:
- The homepage to load.
- Product pages to load.
- Checkout to fail on submit with a 500 error or stuck spinner.
Similarly, your public pages may be fine while /wp-admin is inaccessible, which affects your team’s ability to fulfil orders or update content.
Monitoring only the homepage will not catch these partial outages. You need targeted checks for key paths.
Extreme slowness under load
A site that technically responds but takes 20 seconds to load is effectively down for many visitors. They will leave long before the page appears.
This kind of “slow motion” outage often happens when:
- Traffic spikes hit a small shared hosting plan.
- Cron jobs or imports run at the same time as peak visits.
- Bad bots and crawlers consume a large share of server resources.
Performance-focused monitoring can treat response times above a threshold as failures, which gives a truer picture than simple availability checks alone.
Security-related downtime
Malware, brute force and bad bots overwhelming your site
Security incidents can cause downtime even when the server itself is healthy. Examples include:
- Massive brute force login attempts consuming PHP processes.
- Scraper bots crawling thousands of URLs per minute.
- Malware sending spam or running expensive scripts.
This kind of traffic can quietly starve legitimate visitors of resources. Effective bot filtering at the edge is very helpful here. G7Cloud’s bot protection within the G7 Acceleration Network filters abusive and non human traffic before it reaches PHP or the database, which reduces wasted load and makes uptime more stable during busy periods.
Mitigation events and rate limiting
Sometimes your security tools or hosting provider will intentionally limit or block requests to protect the site. For instance:
- Web application firewalls blocking suspicious payloads.
- Rate limits applied to specific IPs or countries.
- Maintenance mode triggered during malware cleanup.
From a monitoring perspective, these are still downtime events, even though they are in response to an attack. Your logs and firewall dashboards are important sources of context when you investigate alerts.
What “proper” uptime monitoring looks like
Why checking your site manually is not enough
Many site owners check their sites by loading the homepage once or twice a day. This is better than nothing, but it has several flaws:
- You only see one moment in time.
- You only test from your own location and device.
- You rarely test checkout or forms in a structured way.
Real outages can easily happen between your manual checks. And if there is a DNS or routing issue affecting some regions but not yours, you may never see it.
Automated uptime monitoring solves this by running tests on a fixed schedule from multiple locations and alerting you as soon as something fails consistently.
Key features you actually need in an uptime monitoring setup
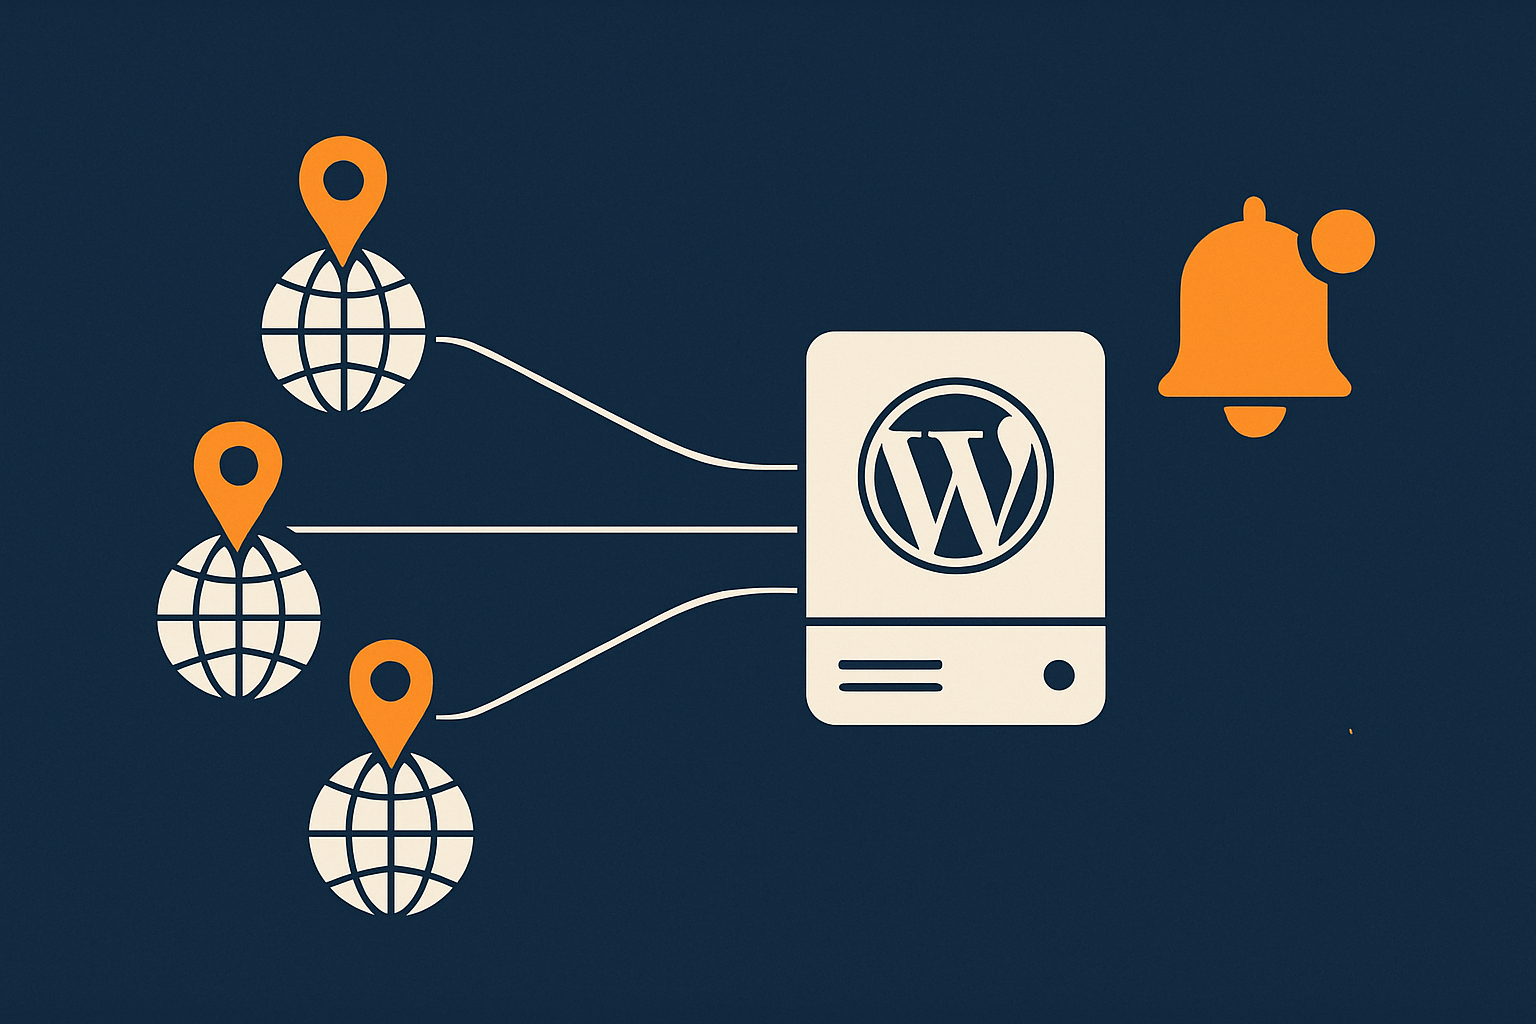
External monitoring from multiple locations
Good uptime monitoring runs from outside your hosting provider’s network and from more than one region. This helps distinguish between:
- Your own connectivity issue vs a genuine site problem.
- A regional routing issue vs a global outage.
Look for tools that let you choose several locations, such as UK, mainland Europe and the US, and treat a check as failed only if several locations report an issue.
HTTP checks vs simple ping checks
Ping checks only verify that the server responds at the network level. They do not confirm that the web stack or WordPress site is actually working.
HTTP or HTTPS checks go further:
- They make an actual web request to a URL.
- They can verify the HTTP status code (e.g. 200 vs 500).
- They can sometimes verify content, such as a keyword on the page.
For WordPress, HTTP(S) checks are the minimum sensible option. They will catch more meaningful problems than ping alone.
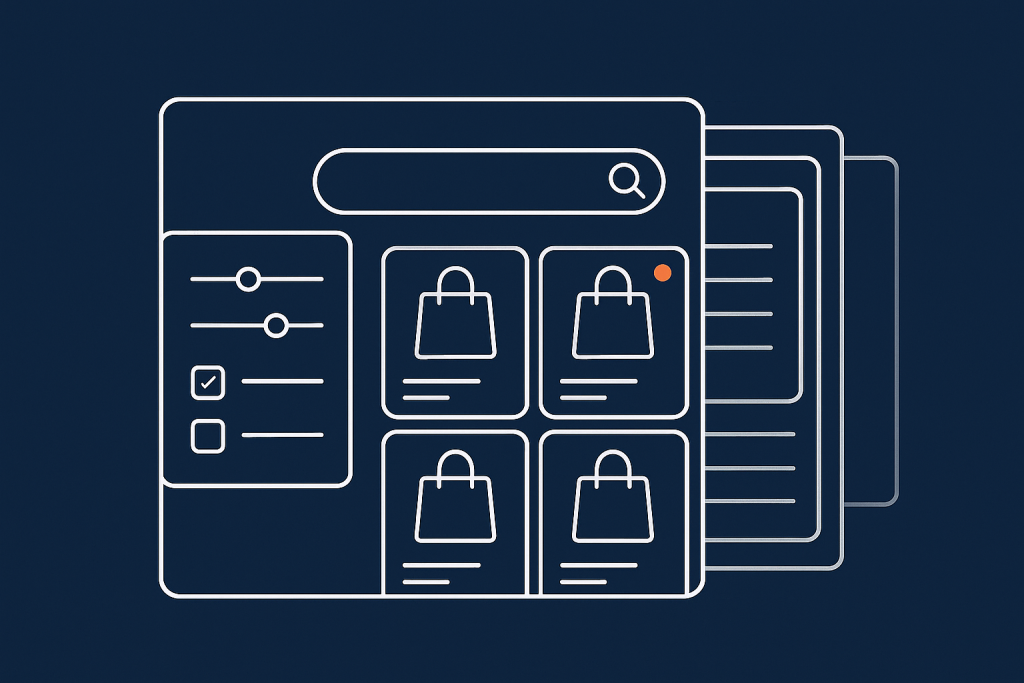
Monitoring key user journeys, not just the homepage
For business sites, the homepage is rarely where the money changes hands. Proper monitoring should include:
- Your main sales or enquiry landing pages.
- Any “Thank you” or confirmation pages for important forms.
- WooCommerce cart, checkout and account pages.
- Login and
/wp-adminif operational access is business critical.
Some monitoring tools support multi-step checks (synthetic transactions) that can:
- Load the homepage.
- Click to a product page.
- Add to basket and go to checkout.
That level of monitoring gives you a much more realistic picture of uptime.
Alerting channels: email, SMS, Slack and escalation
Monitoring is only useful if it reaches someone who can act. Look for tools that support:
- Email alerts for normal notifications.
- SMS or mobile push for urgent outages.
- Slack or Microsoft Teams for team visibility.
Ideally, you can configure escalation rules so that:
- First alerts go to one person or channel.
- If the issue is not resolved within a set period, it escalates to a wider group.
How often should you check? Choosing sensible intervals and timeouts
Monitoring every 30 seconds from ten locations might sound thorough, but it will cost more and may create noise. For most UK businesses:
- 1–5 minute intervals are sensible for critical pages.
- 5–10 minute intervals are fine for less critical checks.
- Timeouts of 10–20 seconds avoid classing minor blips as outages while still catching real problems.
A common approach is:
- Run a check every minute.
- Require failure from at least 2 locations.
- Require 2–3 consecutive failures before sending an alert.
This filters out most short term network hiccups without delaying genuine alerts too much.
Step by step: setting up uptime monitoring for a WordPress site
Step 1: Decide what really needs monitoring on your site
Start by listing the parts of your site that truly matter for revenue, leads and operations.
Public homepage
Include the homepage in your checks because it is often the first page people see, and it is usually cached and light. Homepage failures often indicate broad problems.
Key landing pages and forms
Identify the URLs that matter most, such as:
- Top PPC or campaign landing pages.
- The main “Contact” form.
- Any “Request a quote” or booking forms.
Set up HTTP checks that verify these pages return 200 status codes, and optionally that a specific word or phrase appears in the HTML (for example “Thank you for your enquiry”).
WooCommerce cart and checkout pages (if applicable)
For shops, configure checks for:
/cart//checkout//my-account/or relevant account pages
If your monitoring provider supports it, use a transaction check that adds a test product to the cart and attempts to reach the checkout page. You do not necessarily need to run an actual payment; reaching the payment step is usually enough to confirm things are working.
Login and /wp-admin for operational awareness
It is often useful to monitor:
/wp-login.phpor your custom login URL./wp-admin/dashboard, if it is important to fulfil orders quickly.
This helps you notice when the public site is fine but your team cannot log in to process orders or update content.
Step 2: Choose an uptime monitoring tool
Free vs paid tools and what you get for each
Free uptime tools are usually enough for basic homepage checks. They tend to offer:
- Limited number of URLs.
- Longer minimum intervals (e.g. 5 minutes).
- Email alerts only.
Paid tools typically add:
- More checks across multiple domains.
- Short intervals down to 1 minute.
- SMS, phone call or Slack alerts.
- Multi-step transaction monitoring.
- Performance metrics alongside availability.
For most small businesses, a modest paid plan is usually worth the cost if your site is an important part of revenue or lead generation.
What to enter for URL, interval and timeout
When you create each check, you will usually need to set:
- URL: Use the full HTTPS URL as visitors see it, including
https://and the correct domain. - Method: GET is fine for normal checks.
- Interval: 1–3 minutes for key pages, 5–10 for others.
- Timeout: 10–15 seconds for most sites; more if your audience is truly global.
If there is a redirect (for example from http:// to https://), most tools will follow it automatically. If they do not, update the URL to match your final destination.
Step 3: Configure useful, not noisy, alerts
Setting thresholds and grace periods
To avoid noise:
- Trigger alerts only after 2–3 consecutive failures.
- Use a short grace period, e.g. wait 2 minutes before sending the first alert.
- Enable “recovery” alerts when the site comes back online.
For minor checks you might only want daily summaries, not instant alerts.
Who gets alerted for what
Decide roles before an incident happens:
- Technical person or provider gets real-time outage alerts.
- Operations or customer support gets notified if downtime exceeds a certain time, so they can prepare messaging.
- Business owner receives weekly or monthly reports rather than every alert.
Use different alert channels for different severity levels. For example, email for minor, SMS or phone call for major prolonged outages.
Step 4: Test your alerts safely
Once everything is configured, test it:
- Temporarily point a check at a non-existent URL on your site to trigger a 404 or 500.
- Lower the failure threshold so it alerts after 1 failure.
- Wait for the alert to arrive, confirm the right people and channels are used.
- Restore the correct URL and reset thresholds.
This small test gives you confidence that when there is a real issue, alerts will work as expected.
Going deeper: monitoring performance and “soft failures”
Why page speed and server response time belong in your uptime picture
In practice, slow is often as bad as down. Including performance data alongside uptime helps you spot issues before they become full outages, such as:
- Gradually increasing server response time under growing traffic.
- Specific times of day where pages always slow down.
- New plugins or themes that introduce heavy queries.
You can monitor metrics like Time To First Byte (TTFB), total page load time and Core Web Vitals. Again, image weight is an often overlooked factor. When your platform delivers AVIF/WebP automatically, as the G7 Acceleration Network does for hosted sites, you remove a major source of bloat without extra plugins, which makes performance issues easier to interpret.
For a practical deep dive into performance tools and metrics, see How to Diagnose Slow WordPress Performance Using Real Tools and Metrics.
Using synthetic checks and real user monitoring together
Synthetic checks for repeatable tests
Synthetic checks are controlled tests from known locations and browsers. They are ideal for:
- Comparing performance before and after changes.
- Monitoring specific paths like checkout on a schedule.
- Testing in conditions similar to target users (e.g. UK location, mobile connection).
They complement uptime checks by giving you repeatable, apples-to-apples data.
Real user monitoring for real world issues
Real User Monitoring (RUM) adds another layer by measuring actual visitors’ experiences using JavaScript in the browser. It reveals:
- Regions or ISPs where performance is particularly bad.
- Devices or browsers that struggle with your site.
- Differences between logged-in and guest users.
Using synthetic checks and RUM together provides both consistency and real-world accuracy.
Watching for early warning signs inside WordPress
Error logs, PHP crashes and 5xx spikes
External monitoring tells you something is wrong. Logs tell you what and why. Look at:
- PHP error logs for fatal errors and memory issues.
- Web server logs for spikes in 5xx responses.
- Application logs from security plugins or firewalls.
Many managed WordPress hosting platforms, including managed WordPress hosting with G7Cloud, provide easy access to these metrics and can help interpret them when you open a support ticket.
Database overload and background jobs
WordPress relies on the database for almost everything. Signs of trouble include:
- Slow admin screens, especially for orders or posts.
- Timed-out queries or “Error establishing a database connection”.
- Cron jobs taking longer and overlapping with each other.
Monitoring database health and reviewing scheduled tasks (cron events, imports, backups) can highlight patterns that line up with uptime alerts.
How good hosting and infrastructure reduce downtime risk
The link between server resources, traffic spikes and uptime
Even the best monitoring cannot fix underpowered hosting. If your plan does not have enough CPU, RAM or I/O, you will hit resource limits under load and see slowdowns and 5xx errors.
Key factors include:
- How many concurrent PHP workers are available.
- Whether resources are dedicated or heavily shared.
- How the host handles traffic spikes and “burst” capacity.
If uptime alerts regularly coincide with marketing campaigns, email blasts or seasonal peaks, it may be time to increase capacity or move to more robust specialist WooCommerce hosting or similar.
Why bad bots quietly eat into your uptime and capacity
Filtering abusive bots before they hit PHP
It is common for 30–60% of traffic to be non-human. Some of this is legitimate (search engines), but a lot is junk: scrapers, brute force tools, price crawlers and low-quality scanners.
If these requests all reach PHP and the database, they occupy workers and connections that should be serving real visitors. Edge-level bot filtering, like G7Cloud’s protection as part of the G7 Acceleration Network, screens this traffic before it reaches WordPress, which directly reduces load and volatility.
How this keeps response times steady under load
By cutting out abusive or obviously automated traffic, your remaining capacity is dedicated to genuine visitors. That translates into:
- More consistent response times during peaks.
- Fewer slowdowns that trigger “soft downtime” alerts.
- Lower risk of cascading failures caused by overload.
Your uptime monitoring then reflects true customer experience rather than spikes of bot noise.
Caching, CDNs and the G7 Acceleration Network
How reverse proxy caching can keep sites responsive during incidents
Reverse proxy caching stores full page responses at the edge or in front of PHP. When it is configured properly:
- Most users receive cached pages from fast edge nodes.
- PHP and the database handle far fewer requests.
In some failure scenarios, such as temporary database issues, cached pages can continue to serve many visitors even while the origin has problems. This can reduce the practical impact of incidents on non-logged-in traffic.
Protecting against abusive traffic so uptime monitoring reflects real problems
Combining caching with intelligent traffic filtering is powerful. An edge network like the G7 Acceleration Network can cache static and semi-static content, optimise images into AVIF/WebP automatically, and block abusive bots before they consume resources. That means when your uptime monitor says the site is slow or down, it is more likely to be a real underlying issue rather than the result of noisy traffic.
Maintenance, updates and backups as uptime tools
Regular maintenance is part of uptime strategy, not an optional extra:
- Keeping WordPress core, themes and plugins updated reduces security risk and compatibility issues.
- Routine database optimisation and cleanup helps performance.
- Reliable backups give you a way to recover quickly if an update or incident breaks the site.
Managed platforms such as managed WordPress hosting with G7Cloud aim to take much of this off your plate, handling backups and updates carefully so you have fewer surprises that cause downtime.
What to do when your uptime monitor says your site is down
Confirm the problem: local issue or real outage?
When an alert arrives, do not panic. First, confirm what is happening:
- Use a tool that loads your site from more than one region.
- Try loading the site from your mobile data and from your office connection.
- Check whether all pages are affected or just some.
If only you are having trouble and external tests look fine, it may be a local network or DNS caching issue.
Quick triage steps for non-technical site owners
Check domain, DNS and SSL
Verify that:
- Your domain registration has not expired.
- Nameservers are still pointing to the correct host.
- DNS records (A, CNAME) look as expected.
- Your SSL certificate is valid and not expired.
Many control panels and registrars show renewal dates and DNS status clearly.
Check with your hosting provider and status page
Most reputable hosts maintain a public status page. If an incident is ongoing at the data centre or network level, it will usually appear there.
If the status page is clear but you still see problems, open a support ticket including:
- Time the problem started.
- URLs affected.
- Screenshots or error messages.
- Any monitoring logs you have.
Look for recent changes: plugins, themes, updates
Many outages follow a change. Consider:
- Did you or a colleague update WordPress, plugins or themes recently?
- Was a new plugin or integration installed?
- Were settings changed in a caching, security or redirect plugin?
If your host supports staging sites, you can often test recent changes there first in future, reducing the risk of production downtime.
Communicating with customers during downtime
Using status pages and social media
Transparency helps maintain trust. When you confirm a real outage:
- Update a status page if you have one.
- Post a short update on social media channels your audience actually uses.
- Keep messages factual: what is affected, what you are doing, and when you will update again.
Temporary landing pages and alternative contact options
In longer outages, it can be worth:
- Using a static temporary page explaining the issue, hosted separately if needed.
- Pointing DNS to a simple fallback page.
- Providing alternative contact methods such as a phone number or backup email.
Even basic communication can reduce frustration and support load.
Review and learn: how to reduce the chance of a repeat
After each incident, take time for a simple review:
- What exactly failed and why?
- How quickly did monitoring detect it?
- How quickly could you or your provider respond?
- What could be changed to prevent or soften a similar event?
Sometimes the answer is better processes. Sometimes it is a clear signal that you have outgrown your current hosting setup. For broader context on infrastructure choices, the guide Shared, VPS or Dedicated Hosting: How to Choose the Right Foundation for Your Business is a useful next read.
Putting it all together: a simple uptime checklist for WordPress
A practical checklist you can implement this week
To bring everything into one place, here is a concise checklist you can work through:
- List your critical pages and journeys:
- Homepage, top landing pages, key forms.
- WooCommerce cart, checkout and account (if relevant).
- Login and admin URLs if operations depend on them.
- Choose an uptime tool:
- Start with a free plan if budget is tight, but consider upgrading for better alerts and transaction checks.
- Set up HTTP(S) checks:
- Use 1–3 minute intervals for critical paths.
- Set sensible timeouts (10–15 seconds).
- Validate status codes and, where useful, keywords in content.
- Configure alerts:
- Require 2–3 consecutive failures before alerting.
- Send alerts to the right people via appropriate channels.
- Test alerts under safe conditions.
- Add basic performance monitoring:
- Track server response time and page load times.
- Note any recurring slow periods and match them against logs and traffic patterns.
- Review hosting and infrastructure:
- Check that your plan has capacity for your peak traffic.
- Use caching and, ideally, an edge network to reduce origin load.
- Ensure backups and security practices are in good shape.
- Document a simple incident procedure:
- Who checks what when alerts arrive.
- How to contact your host quickly.
- How to communicate with customers if downtime is extended.
When to consider moving hosting or upgrading your setup
Your monitoring data is valuable feedback. Over a few weeks or months, patterns may emerge:
- Frequent small outages at busy times.
- Regular database or PHP errors under modest load.
- Slow response times even with basic optimisation.
When you see these signs repeatedly and fixes within WordPress are not enough, it is often time to look at your hosting foundation. If you want a more robust platform with fewer headaches, exploring managed WordPress hosting or G7 Acceleration Network options with G7Cloud can be a sensible next step. The goal is not simply a higher uptime percentage on a sales page, but a more predictable, resilient experience for your visitors and your team.